Monthly Report 04/2025

Photo: Andreas Busslinger
Publications

Stable world economic outlook

At the beginning of 2025, the global economy seemed to be doing well. Since then, momentum has slowed somewhat, but the global composite purchasing managers’ index (PMI) still corresponds to trend-like growth. We are therefore maintaining our main scenario that we continue to expect global economic growth of around 3% this year. The OECD is also forecasting real growth of this magnitude in the current and coming year.

The biggest economic risk is seen in US trade policy and the correspondingly low growth in gross domestic product in the US. GDP growth there is expected to slow to 1.6% in 2026 due to disruptive US tariff and trade policies. Fears and uncertainty have erased optimism among SMEs. The prospects of a continued inflationary policy remain significant and are thus weighing on investor sentiment and capital market sentiment. In the short term, therefore, a prolonged correction is to be expected. Fears of an imminent recession in the US appear exaggerated to us, but the risk of stagflation remains real.

Our view at the beginning of the year that European equities were attractively valued has been fulfilled sooner than expected. The European Central Bank has also returned to a neutral monetary policy and European decision-makers have taken decisive measures to boost the economy and ensure peace. Momentum is currently in favor of European equities, but disciplined diversification is needed.

Positive result in the first quarter

The conditions for a positive performance in the first quarter were highly challenging. The global stock index (BBG World -4.2% in CHF) did not fall as sharply as the dominant US S&P 500 stock index (-4.6% in dollars, -7.1% in CHF). The tech index (-10.4% in dollars, -12.7% in CHF) plunged into a correction phase. The global bond index (+0.2% in CHF) remained stable, while the Swiss bond index (-1.3% in CHF) slid noticeably. The mood of optimism in Europe was therefore welcome. Swiss equities (SMI: +8.6%) rose sharply and were in line with the performance of European stock indices.

In the case of individual stocks, the total return in the first quarter ranged widely (in CHF): from Nvidia (-21%), Alphabet (-20%), Amazon (-15%) and Apple (-13%) at one end to equities such as Helvetia (+22%), Cembra Money Bank, Allianz and Deutsche Telekom (each +21%), Engie (+20%), Nestlé, Veolia and Vinci (each +19%) at the other.

In this capital market environment, the defensive risk class 1 achieved a slightly positive return in the first quarter of 2025. In the “balanced” risk class 3, the volatile US tech stock performance was noticeable, even more so in the dynamic risk class 5, which closed the quarter up +2.0%. The dividend strategy is currently performing exceptionally well. This is due to a large number of strong dividend stocks. US equities are not included in this strategy.

Strategies mainly based on individual titles Strategy performance*
March 2025 YTD 2025
Zugerberg Finanz R1 –0.7% +1.4%
Zugerberg Finanz R2 –1.0% +1.8%
Zugerberg Finanz R3 –1.3% +1.7%
Zugerberg Finanz R4 –1.7% +1.6%
Zugerberg Finanz R5 –1.8% +2.0%
Zugerberg Finanz RDividends +0.7% +9.2%
Zugerberg Finanz Revo1 –1.1% +1.1%
Zugerberg Finanz Revo2 –1.8% +1.3%
Zugerberg Finanz Revo3 –2.1% +1.2%
Zugerberg Finanz Revo4 –2.4% +1.6%
Zugerberg Finanz Revo5 –2.7% +2.0%
Zugerberg Finanz RevoDividends –0.1% +8.4%
Zugerberg Finanz DecarbRevo3 –1.2% –0.5%
Zugerberg Finanz DecarbRevo4 –1.0% –0.5%
Zugerberg Finanz DecarbRevo5 –0.8% –0.3%
Zugerberg Finanz Vested benefits Strategy performance*
March 2025 YTD 2025
Zugerberg Finanz Vested benefits R0.5 –0.6% +0.8%
Zugerberg Finanz Vested benefits R1 –0.8% +1.4%
Zugerberg Finanz Vested benefits R2 –0.8% +1.7%
Zugerberg Finanz Vested benefits R3 –1.3% +2.0%
Zugerberg Finanz Vested benefits R4 –1.6% +2.2%
Zugerberg Finanz 3a pension solution Strategy performance*
March 2025 YTD 2025
Zugerberg Finanz 3a Revo1 –1.1% +1.1%
Zugerberg Finanz 3a Revo2 –1.8% +1.3%
Zugerberg Finanz 3a Revo3 –2.1% +1.2%
Zugerberg Finanz 3a Revo4 –2.4% +1.6%
Zugerberg Finanz 3a Revo5 –2.7% +2.0%
Zugerberg Finanz 3a RevoDividends –0.1% +8.4%
Zugerberg Finanz 3a DecarbRevo3 –1.2% –0.5%
Zugerberg Finanz 3a DecarbRevo4 –1.0% –0.5%
Zugerberg Finanz 3a DecarbRevo5 –0.8% –0.3%
* The stated performance is net, after deduction of all running costs, excluding contract conclusion costs

Macroeconomics

Europe is in a good position

In terms of customs policy, China, Mexico and Vietnam are under particular pressure. US President Donald Trump is also at loggerheads with the eurozone over the balance of goods. There is indeed a deficit here, because the US sells fewer goods to the eurozone than the other way around. However, if we look at the balance of services, the perspective changes. The US has a large and growing surplus. The EU is therefore seeking to establish a free trade agreement in goods and services with the US.

Read more Close
Balanced current account between the USA and the eurozone (Source: European Central Bank, Allianz Research | Graphic: Zugerberg Finance)

Donald Trump has no problem selectively perceiving individual economic factors and using them to derive demands for a “fair” balance with the US. While various countries do indeed maintain a very unequal exchange of goods and services with the US, the situation with regard to the eurozone and the European Union is more complex.

For Europe, negotiations with Donald Trump must go beyond goods. In particular, the EU is dependent on liquefied natural gas (LNG). Otherwise, the dispute over aluminum, steel, wine, motorcycles and bourbon is of little use. The European Union has clearly signaled its willingness to negotiate. It is in a good position, because it could use the trade in services as leverage.

The US has a significant trade deficit with Europe in the trade in goods, but the relationship is more balanced when considering the trade in services. In the third quarter of 2024, the US had a cumulative surplus of $105.9 billion with the eurozone over four quarters. If net factor income from abroad is included, the current account (i.e. the trade and services balance added together) is balanced.

Simply put: Europe achieves surpluses in the trade in goods, while the US achieves surpluses in the trade in services, particularly financial and internet services. The weaker dollar and the emerging trend towards an even weaker dollar should boost American service exports while dampening imports of goods.

Numerous research papers show that trade policy uncertainties reduce GDP by delaying investment. By contrast, the impact of trade policy uncertainties on employment is less clear. Overall, we are heading towards moderate real GDP growth in the US (+1.6%; 0.8% less than at the beginning of the year) and in Europe (+1.3%; 0.5% more) in the current year. But the picture is changing, particularly in Europe, and the stock markets – as leading economic indicators – share this view.

European equities have had a good start to the new year, driven by improving economic indicators, attractive valuations and a favorable monetary policy environment. This is likely to become more pronounced in the coming months. US investors, too, only experience the true benefits of diversification if they also include Europe in their portfolio. All too many US investors have completely abandoned Europe in recent years. At present, a return is on the cards because the technical momentum factors do not signal any additional US equity exposure.

Region 3–6 months 12–24 months Analysis
Switzerland We expect real GDP growth of +1.3% (2025), based on rising real wages and a looser monetary policy.
Eurozone, Europe The growth potential is greater than many expect and can be exploited without driving up inflation due to the available production capacities.
USA Geopolitical and trade policy uncertainties have a far-reaching impact on the domestic population and hinder the optimal exploitation of growth potential.
Rest of the world Global developments continue to pose the main risk for the Swiss economy. According to the OECD, however, the outlook remains intact.

Liquidity, currency

The euro gained while the dollar lost ground

The signs of weakness in the US economy were immediately acknowledged with a weaker dollar. The US Federal Reserve sees a risk of stagflation in the US due to the drastic tariff increases, rapidly increasing political uncertainty and deteriorating consumer sentiment. The euro, on the other hand, gained in value as the “United States of Europe” is willing to do more for its security and defense.

Read more Close
The exchange rates of the US dollar and euro against the Swiss franc over the last 5 years (Source: Bloomberg Finance L.P. | Graphic: Zugerberg Finanz)

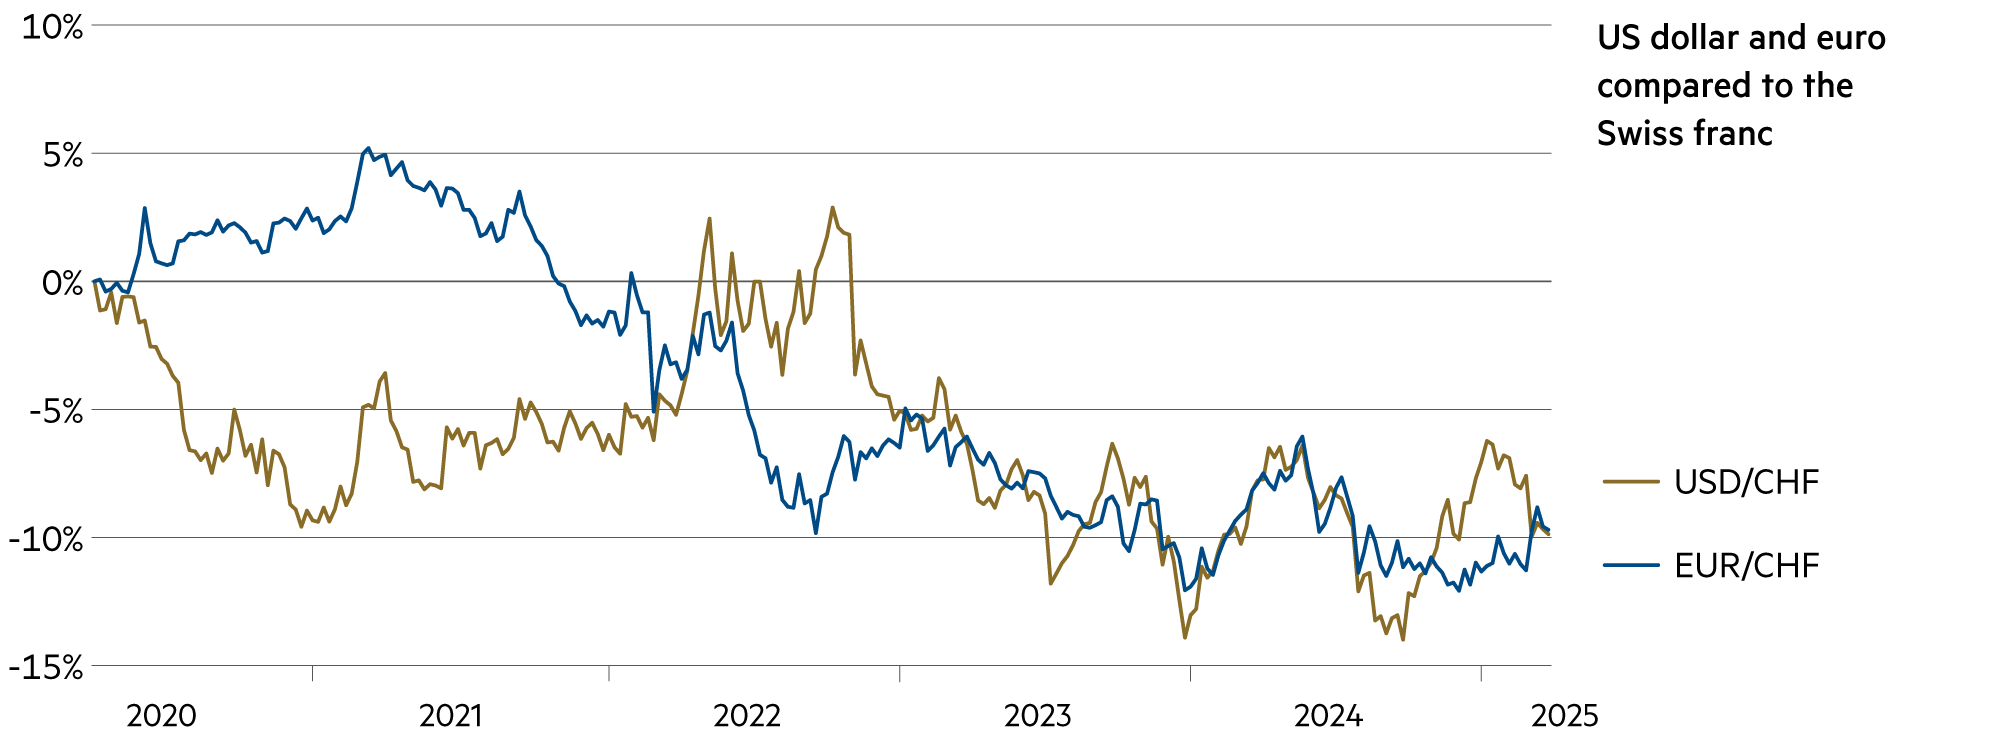
But over five years, one thing is clear: both currencies (euro and dollar) are on a downward trend against the Swiss franc. The euro lost 9.8% during this period, the dollar 8%. According to purchasing power parity, however, the dollar is under greater downward pressure.

Consumer sentiment in the US is also being cited as a sign of weakness. It has plummeted under the influence of erratic tariff policy, when long-term inflation expectations (3.9%) reached their highest level in 32 years. This underscored fears that Donald Trump’s economic policy is weighing on the economy.

The University of Michigan’s sentiment index fell to 57.9 in March. This is the third consecutive monthly decline and significantly lower than economists had expected. Retail sales did at least pick up slightly in February (+0.2%) after falling sharply in January (-1.2%). In the US, the wealth effect plays a central role because 90% of savings are invested in equities. If US equity prices fall, this has an immediate impact on consumer sentiment – not only among low-income households, but also among high-income and wealthy households. Finally, consumer behavior in restaurants and bars is closely monitored. Here, there was the sharpest decline in a year.

After the Federal Open Market Committee (FOMC) cut interest rates by a total of 100 basis points in the last three monetary policy meetings of 2024, it voted in January to leave the target range for the federal funds rate at 4.25% to 4.50% and confirmed this in March. There is no significant change in the forward guidance on key rates in the updated Fed statement.

However, the FOMC’s economic forecasts are pessimistic. The median forecast for GDP growth in 2025 fell from 2.1% to 1.7%, with a range of 1.5% to 1.9%. The median forecast for the unemployment rate at the end of 2025 rose from 4.3% to 4.4%, and that for core PCE inflation rose from 2.5% to 2.8%. The range for core inflation has widened in view of the many uncertainties and is 2.5% to 3.5% for the current year.

This means that the probability of an economic downturn is greater than that of an upward movement. It remains unclear where the downward trend will end. In any case, the probability of a recession increased to 27% according to the Fed in New York. The Fed’s forecast unit in New York currently sees an unchanged high, significant increase (+2.9%) in the real-time GDP estimate. By contrast, the Fed in Atlanta currently sees a significant decline (-2.8%).

Asset class 3–6 months 12–24 months Analysis
Bank account At the short end, banks are lending to each other at just 0.18% (3 months), 0.16% (6 months) and 0.12% (12 months). The scope for interest rates is narrowing.
Euro / Swiss franc The ECB is highly likely to move to the next interest rate hike on April 17, which would take the target rate to 2.25%.
US dollar / Swiss franc The Fed fund rates will remain unchanged at a high level until June 18, and will continue to be restrictive, forcing the economy to cool down.
Euro / US dollar The exchange rate could rise from the current 1.08 to 1.15-1.18 within twelve months if the European economy continues to accelerate.

Bonds

Bond markets remain calm

Stocks in the world’s most important market (the US) recently fell to a six-month low. There are also signs as to why the significant volatility observed in recent weeks is likely to continue. By contrast, we are still seeing historically rather low values for the risk premiums for high-quality bonds. We interpret this as a positive sign. Only a significant widening of credit risk premiums (so-called “credit spreads”) could be a cause for concern.

Read more Close
Risk premium for US bonds with a “BBB” rating over the past five years (Source: FRED, Federal Reserve Economic Data | Graphic: Zugerberg Finanz)

We still do not see a broad-based risk-off movement in bonds. Credit spreads are close to historical lows. There has been a slight parallel shift in the curves in all three markets (USD, EUR, GBP), with lower-rated and subordinated bonds underperforming. Meanwhile, it can also be seen that sectors are not a major factor. Rather, it is the lost optimism in the US.

Only there do increased risk premiums indicate increasing market tensions. For high-yield industrial bonds, these increased from 275 to 327 basis points (+52 bp) from November 2024. The increase was even more pronounced for US utility companies, at 76 basis points. At the same time, risk premiums in the European capital market fell: for high-yield bonds, this was typically more pronounced than for bonds with a very good credit rating.

The market seems to be abandoning its optimistic outlook following Donald Trump’s election. The US bond markets, otherwise known for their excessive pessimism, are once again paying little heed to optimistic signals. By contrast, the bond markets in Europe remain surprisingly calm despite the increasing trade tensions. In high-yield corporate bonds, risk premiums on bonds maturing between 3 and 5 years have fallen from 346 to 320 basis points (-26 bp) since November 2024.

We remain constructive on corporate bonds, based on strong corporate fundamentals and strong technical factors, supported by attractive yields to maturity. Nevertheless, we are flexible and agile in the face of increased macroeconomic uncertainty and widening dispersion. We are focusing on certain sectors and selecting issuers carefully in order to avoid negative idiosyncratic credit events. We have already significantly reduced our holdings in sectors such as carmakers and their suppliers over the past few months.

Overall, the European bond market should rise. New bonds will be issued to cover the planned investments in infrastructure and peacekeeping. However, yields are not likely to rise further because the debt-to-GDP ratio in Germany and the eurozone as a whole is much more reasonable compared to many nations around the world, including the United States and Japan. To the extent that infrastructure improvements also boost European GDP growth, this will also help European equities overall.

Asset sub-class 3–6 months 12–24 months Analysis
Government bonds The EU has to pay 3.2% interest on its bonds. Only a few member states pay more. It remains unclear whether a defense fund is needed for this reason.
Corporate bonds CHF corporate bonds performed significantly better than Swiss government bonds in the first quarter of 2025: -0.5% vs. -2.8%.
High-yield, hybrid bonds Subordinated and high-yield corporate bonds continue to be favored in our balanced portfolios, subject to disciplined selection.

Zugerberg Finanz bond solutions

Stability in difficult times

In the first quarter of 2025, our bonds provided stability in a difficult environment, while, for example, Swiss government bonds performed miserably (-2.8%). The entire Swiss Bond Index (-1.3%) slid back. With relatively low volatility, our performance range was from the conservatively oriented Zugerberg Income Fund (ZIF: +0.3%) to the premium-oriented Credit Opportunities Fund (COF: +1.2%).

Read more Close
Bond strategies since the beginning of 2025 in Swiss francs (Source: Bloomberg Finance L.P. | Graphic: Zugerberg Finanz)

The inclusion of bonds in a mixed portfolio makes sense in order to at least hope for positive returns from the conservative bond component in the event of a recession. For investors who do not want to take on the risk of the stock market alone, bonds also offer a secure long-term alternative.

Since its launch around 13 years ago, the Credit Opportunities Fund has generated a total return of 35.9%. The fund rating agency Morningstar awards the maximum 5 stars for this and Citywire, another fund agency, recently gave the top AAA rating for long-term performance. By comparison, the Swiss Bond Index, which tracks the COF with all its AAA to BBB-rated bonds (mainly Swiss government bonds and mortgage-backed covered bonds), achieved a total return of 8.5% over 13 years. The COF is not limited to these rating categories: at the end of the month, around 35% is invested in the AAA to BBB range, with 65% slightly lower. However, the lower rating is compensated for by a shorter remaining term.

If you look at a company’s balance sheet, you see that borrowed capital (e.g. bonds) and equity (e.g. shares) are on the same liabilities side. If something goes wrong on the assets side, it is the equity that is affected first. To compensate for this, equity yields are structurally higher than bond yields. As active bond investors, we naturally try to avert this disaster prospectively. If we see black clouds gathering in certain sectors (e.g. automotive), the corresponding bonds are reduced. On the other hand, if we identify attractive risk premiums in more complex bond areas (e.g. subordinated insurance bonds with an investment grade rating), these are relatively overweighted.

With an active bond approach and at competitive costs, passive, index-tracking bond ETFs can be outperformed over the longer term, both in terms of performance and in the Sharpe ratio (an indicator for measuring risk-adjusted returns). In addition, a detailed analysis of bonds often yields insights that can also be productively applied to disciplined selection in equity markets, provided that the equities are not held in family holdings or private market funds.

There are well-known examples of this, including Hero (Lenzburg) and Bobst (Lausanne). Sometimes, however, it is also a matter of lesser-known companies such as Geoquip Marine (St. Gallen), which is a global leader in a niche market. The latter, for example, specializes in geotechnical offshore activities to secure the installation of wind turbines and power cables at depths of 60 to 100 meters below the sea surface.

Zugerberg Income Fund Credit Opportunities Fund
Yield in 2025 (since the beginning of the year) +0.3% +1.2%
Yield since the start (annualized) -7.5% (-1.1%) +35.9% (+2.5%)
Proportion of months with positive yield 54% 68%
Credit risk premium in basis points (vs. previous month) 96 BP (+5 BP) 393 BP (+19 BP)
Average rating (current) A BB+

Real estate, infrastructure

Attractive infrastructure stocks

Infrastructure can be thought of as the basic facilities of an economy. They have the character of intermediate inputs for all private and public economic activity. A growth-oriented economy therefore needs an intact, reliable infrastructure. This requires economic planning and efficient operation – of everything from roads, railways, waterways and airways to telecommunications, electricity and water supply.

Read more Close
The first Airbus A350 with Swiss registration landed in Zurich on 12 March 2025 (Image source: Edelweiss Air)

In the first quarter, our Swiss infrastructure stocks performed moderately. BKW (-3%) is undergoing a period of consolidation after a strong share performance in recent years. The share of Zurich Airport (-3.9) is also behaving in line with the European transport sector average, although new, popular European destinations will be added with the new flight schedule in summer 2025. A total of 63 airlines will fly to 206 destinations, thanks to Edelweiss with Seattle and Halifax, there will be an expanded twice-weekly service to North America with the low-noise Airbus A350. In addition, Etihad Airways is increasing its connections between Zurich and Abu Dhabi, also in the significantly quieter A350. But the main reason for the sideways movement of the share price is certainly the postponement of the opening of the new Noida airport in the south of Delhi “to the end of Q2/2025” and thus also the somewhat cautious guidance for the current year. However, the share is cheap based on the earnings expectations for 2027.

The other infrastructure stocks performed excellently in the first quarter of 2025. Veolia and Vinci (each +19% in CHF) and Engie (+20%) were our selections. A new era is dawning for Europe, and infrastructure is a key sector in this context. Recent announcements (Germany and network investments across Europe) and further options for a competitive EU (transport) not only mobilize public funds, but also lead to great opportunities for privately organized infrastructure operators. And that’s not even taking into account the potential for peace in Ukraine.

Vinci stands for the long-term resilient concession operation of toll roads and airports such as London Gatwick. Last year, this resulted in a free cash flow of EUR 6.8 billion with a gross profit margin (EBITDA) of 18%. The company can borrow relatively cheaply (A- rating with a stable outlook; net leverage of 1.3x), but with liquidity of EUR 19 billion, this is only necessary to a limited extent. The dividend will be increased by 6% and will now be EUR 4.75. This corresponds to a dividend yield of 4.1%. The dividend is significantly higher than ten years ago (1.84) and the impressive increase is ultimately the result of the free cash flow increasing by 12% annually over the last ten years.

Veolia (4.4% dividend yield) also looks forward to a bright future, which will be driven by technology and bolstered by resilience in the three strategic areas of water, energy and waste management, thanks in part to the increased use of AI.

Asset sub-class 3–6 months 12–24 months Analysis
Residential properties CH Overall, less than half of the tenant households are likely to receive a rent reduction in the coming months. There are various reasons for this.
Office and retail properties CH Quality remains key. The structural change in retail space continues. In offices, vacancies are likely to rise from 5.0% to 5.5% in 2025.
Real Estate Fund CH The gap between market and existing rents will continue to widen and will be important for selection, as long-standing tenants avoid moving.
Infrastructure Equity / Fund Engie's global infrastructure-oriented profile is gaining momentum and investor confidence, even though the conglomerate remains complex.

Equity

Europe performed well

In the first quarter, European equities performed very well compared to US equities. However, this should not be overstated, as European equities still have considerable catch-up potential, while US stocks, due to their high valuations, are likely to experience some setbacks. Swiss equities are in the middle range in Europe and are proving to be defensive stocks, especially in markets unsettled by the trade war.

Read more Close
Equity markets (incl. dividends) since 1 January 2025 (Graphic: Zugerberg Finanz)

With the lost “exceptionalism” surrounding US equities, optimism has also evaporated. In too many sectors, it is becoming apparent that comparable performance can be delivered elsewhere, sometimes at more favorable terms. This is the case in the automotive industry (BYD vs. Tesla) as well as in aircraft construction (Airbus vs. Boeing), in industrial engineering (Siemens vs. General Electric) as well as in enterprise data software (SAP vs. Oracle). In the semiconductor industry, Taiwan has been leading for years (TMSC vs. Intel), which is why Nvidia has long since outsourced the production of its semiconductors.

However, this does not mean that US technology stocks such as Amazon, Alphabet and Apple, as well as Microsoft, no longer have a future. But their valuation and concentration on US markets is so high that diversifying away from them leads to noticeable setbacks and, in promising, favorable markets such as Europe, is immediately associated with severe upward revaluations.

But the messages remain true if you dig deeper into Europe. Here is a brief selection, starting with software group SAP (+5% total return in CHF since the beginning of the year), the most highly valued company in Europe. SAP replaced Danish pharmaceutical giant Novo Nordisk in this ranking and also overtook French luxury goods group LVMH, which is feeling the effects of consumer restraint worldwide. As for European leaders, we are also invested in Deutsche Telekom (+20%), Siemens (+17%) and the two insurers Axa (+17%) and Allianz (+21%).

The Swiss heavyweights Nestlé (+19%), Roche (+17%) and Novartis (+14%) have also attracted increased international attention again. This also applies to the Zurich Insurance Group (+14%), which has its largest national market in the US. Interest in insurance was also evident in the cases of Swiss Re (+14%) and Swiss Life (+15%), which are ambitiously pursuing noteworthy medium-term objectives with a great deal of expertise. In addition, a merger between Baloise (+13%) and Helvetia (+22%) is said to be under discussion. This has been discussed before, but failed due to governance issues. Significant synergies in the cost-intensive property insurance business are obvious. Baloise has not generated significant shareholder value over the last 25 years: on November 1, 2000, the share price was CHF 186, on March 31, 2025, it was CHF 185.

Partners Group (+1%) has significantly outperformed its US peer group (Blackstone, KKR, Apollo, Carlyle, TPG) since the beginning of the year, which suffered a 20% drop in value in the first quarter of 2025.

Asset sub-class 3–6 months 12–24 months Analysis
Equity Switzerland At 12'598 points, the Swiss Market Index rose significantly in the first quarter of 2025 compared to the beginning of the year, when it stood at 11'601 points (+8.6%).
Equity Eurozone, Europe The Euro Stoxx 50 rose sharply in the first quarter of 2025 (+7.8%), with the five best stocks all being large banks (e.g. Banco Santander, Unicredit).
Equity USA In the Dow Jones, there were large spreads between top (Amgen, Chevron, Johnson & Johnson) and flop (Amazon, Apple, Nike, Nvidia, Salesforce) in the first quarter of 2025.
Equity Emerging markets The Indian stock indices gained more than 8% in dollars in March, returning to the level seen at the beginning of the year.

Alternative investments

The wave of IPOs has been postponed again

Private market investors have received only small repayments over the past three years. An improvement was hoped for in 2025, but with the increasing uncertainties, the wave of IPOs is likely to shift more strongly to the coming year. Exceptions such as the fintech company Klarna (“buy now pay later”) confirm the overall picture. Nevertheless, a phase is emerging in which investments in private markets are likely to be particularly interesting.

Read more Close
The share of private market investments in ‘Private Wealth’ will increase particularly strongly (Source: Partners Group, CMD 12.03.25, page 7)

The market for “private” investments is currently estimated at around 6,000 billion dollars, which corresponds approximately to one twelfth of the market capitalization of the global stock markets. Similar to a typical stock market investment, with a private equity investment the investor receives a real stake in companies that develop or produce something and let the equity providers participate in the success.

One advantage is the lower volatility. Another is the diversification that comes from investing in different development phases (venture, growth, buyout, pre-IPO) and financing stages of the companies. Finally, a significant part of the value added is achieved before the IPO.

Private equity has become an important asset class for institutional investors worldwide, often accounting for 5% to 15% of their portfolios. The main reason for this is access to actively managed, attractive companies that are not accessible through public markets. At the same time, more and more companies are choosing to remain private for longer, while the number of listed companies has fallen in recent years.

Consequently, investors who ignore private market investments are missing out on an attractive investment universe, particularly in the small and mid-cap segment. With us, you can indirectly participate in private equity through several listed private market companies that invest in private companies worldwide, starting with risk class 2. On average, this has resulted in an annual performance of around 10% in Swiss francs. After two years of above-average returns (2023: +22%, 2024: +19%), the corresponding investment vehicle has been down slightly since the beginning of the year.

As with real estate stocks, the net asset value (NAV) is a compass for valuation. The immediate development for the investor depends on the share price, not on the NAV. Depending on market sentiment, there is a premium (the so-called “premium”, as is currently the case with real estate stocks) or a discount. This is known as a discount and is currently characteristic of private market investments. At the latest when the next wave of IPOs begins, prices are likely to rise disproportionately, turning the discounts into premiums.

Asset sub-class 3–6 months 12–24 months Analysis
Commodities Rising crude oil prices result from a combination of better economic data and supply restrictions due to new US sanctions.
Gold, precious metals Geopolitical uncertainties are likely to push the price of gold into new spheres: it took 17 years to jump from 1'000 $ to 2'000 $, and five years to reach 3'000 $.
Insurance Linked Securities We estimate comparable risks in the form of subordinated insurance bonds, which are analytically demanding due to their complexity.
Private equity According to Partners Group's Capital Markets Day, there is a great deal of confidence in the private wealth sector that the attractive margin market will continue to grow.

Summary

Asset class 3–6 months 12–24 months Analysis
Macroeconomics If the stock markets are correct in their assessment of the economic outlook, the USA is currently heading south while Europe and China are on an upward trajectory.
Liquidity, currencies In Switzerland, short-term swap rates are practically at zero (3 months: 0.18%, 6 months: 0.16%, 9 months: 0.14%, 12 months: 0.12% and 18 months: 0.11%).
Bonds We continue to favor the high-yield crossover segment. Our investment vehicle was recently awarded the top AAA rating by Citywire.
Real estate, infrastructure In terms of overall performance, infrastructure equities are well ahead of real estate equities: valuations for the latter are well above the long-term average.
Equities One argument in favor of US equities is that a strategy of buying on 10% setbacks achieves higher returns than waiting out a 15% or 20% drop.
Alternative investments Rising crude prices resulted from better economic data and Trump's latest sanctions against oil producer Venezuela.

Market data

Asset class Price (in local currency) Monthly / YTD / Annual performance (in CHF)
Equity 31.03.2025 03/2025 2025YTD 2024 2023 2022
SMI CHF 12'598.1 –3.1% +8.6% +4.2% +3.8% –16.7%
SPI CHF 16'800.3 –2.0% +8.6% +6.2% +6.1% –16.5%
DAX EUR 22'163.5 +0.2% +13.2% +20.4% +13.1% –16.3%
CAC 40 EUR 7'790.7 –2.1% +7.4% –1.0% +9.6% –13.9%
FTSE MIB EUR 38'052.0 +0.4% +13.1% +14.1% +20.4% –17.3%
FTSE 100 GBP 8'582.8 –2.1% +5.5% +12.1% –0.3% –8.8%
EuroStoxx50 EUR 5'248.4 –2.0% +9.1% +9.6% +12.1% –16.0%
Dow Jones USD 42'001.8 –6.1% –3.8% +22.1% +3.5% –7.7%
S&P 500 USD 5'611.9 –7.6% –7.0% +33.4% +13.1% –18.5%
Nasdaq Composite USD 17'299.3 –10.0% –12.7% +39.2% +30.6% –32.3%
Nikkei 225 JPY 35'617.6 –5.7% –8.5% +15.2% +8.6% –19.7%
Sensex INR 77'414.9 +5.7% –3.7% +13.8% +7.4% –4.8%
MSCI World USD 3'628.6 –6.5% –4.7% +26.6% +10.8% –18.5%
MSCI EM USD 1'101.4 –1.6% –0.2% +13.6% –2.6% –21.5%
Bonds (mixed) 31.03.2025 03/2025 2025YTD 2024 2023 2022
Glob Dev Sov (Hedged CHF) CHF 152.9 –0.8% –0.2% –1.4% +2.2% –13.2%
Glob IG Corp (Hedged CHF) CHF 184.4 –0.7% +0.8% –0.8% +4.2% –16.7%
Glob HY Corp (Hedged CHF) CHF 361.0 –1.2% +0.2% +6.1% +8.7% –13.6%
USD EM Corp (Hedged CHF) CHF 274.7 –0.8% +1.1% +2.4% +4.5% –18.2%
Government bonds 31.03.2025 03/2025 2025YTD 2024 2023 2022
SBI Dom Gov CHF 181.0 –1.5% –3.1% +4.0% +12.5% –17.0%
US Treasury (Hedged CHF) CHF 138.9 –0.1% +1.9% –3.8% –0.5% –15.0%
Eurozone Sov (Hedged CHF) CHF 176.7 –2.0% –1.9% –0.8% +4.8% –18.9%
Corporate bonds 31.03.2025 03/2025 2025YTD 2024 2023 2022
CHF IG Corp (AAA-BBB) CHF 190.0 –0.2% –0.5% +5.1% +5.7% –7.5%
USD IG Corp (Hedged CHF) CHF 186.5 –0.6% +1.3% –2.4% +3.5% –18.5%
USD HY Corp (Hedged CHF) CHF 608.2 –1.3% +0.1% +3.7% +8.5% –13.7%
EUR IG Corp (Hedged CHF) CHF 166.9 –1.3% –0.6% +2.0% +5.9% –14.1%
EUR HY Corp (Hedged CHF) CHF 302.7 –1.2% +0.0% +5.4% +9.8% –10.9%
Alternative investments 31.03.2025 03/2025 2025YTD 2023 2022 2021
Gold Spot CHF/kg CHF 88'803.9 +7.0% +16.0% +36.0% +0.8% +1.0%
Commodity Index USD 106.4 +1.5% +5.0% +8.3% –20.4% +15.1%
SXI SwissRealEstateFunds TR CHF 2'791.2 +0.1% +2.8% +16.0% +5.4% –17.3%
Currencies 31.03.2025 03/2025 2025YTD 2024 2023 2022
US dollar / Swiss franc CHF 0.8843 –2.1% –2.5% +7.8% –9.0% +1.3%
Euro / Swiss franc CHF 0.9564 +2.1% +1.7% +1.2% –6.1% –4.6%
100 Japanese yen / Swiss franc CHF 0.5899 –1.6% +2.4% –3.4% –15.4% –11.0%
British pound / Swiss franc CHF 1.1423 +0.6% +0.6% +6.0% –4.2% –9.3%
Back to News