Monthly Report 10/2025

Photo: Andreas Busslinger
Publications

Prospects for a positive final quarter

The prospects for a positive final quarter remain intact for our investors. Traditionally, the final quarter is the best of the year. Even if this does not happen, we are confident that we will be able to make a positive contribution to our full-year return in the last quarter. This is because the most volatile phase of US President Donald Trump’s presidency is likely to be over. The capital markets have gradually adapted to his antics and sometimes even react with extraordinary calm to the latest news and decrees from the White House.

In addition, Trump urgently needs to focus more on the overall picture of the US economy if he does not want to emerge as the loser in the important midterm elections in around twelve months’ time. This is because the much-heralded “golden age” under Trump 2.0 has not yet arrived. Inflation remains stubbornly high and is eating into the pockets of the middle class. The labor market is showing unusual weaknesses. This cannot be concealed by replacing the top position at the Bureau of Labor Statistics, the agency responsible for collecting and publishing labor market statistics.

The lack of migration is causing real growth in the US to fall to a modest +1.5% per year – real growth rates that we are also seeing in Europe and Switzerland. Only thanks to exceptionally high AI-related capital investments (CAPEX) could there be an additional GDP boost of around +0.5% in the current year – with a flattening trend next year. This is no more exceptionalism.

Slight setbacks in September

The portfolios suffered slight setbacks in September. The Swiss Market Index (SMI) declined (-0.6%), which had an impact on our portfolios. In the lower-risk portfolios, the positive monthly return in our bond solutions had a noticeable effect. This led to significant performance differences between the various risk classes (e.g., Revo1 with -0.4% in September and Revo5 with -0.7%). A similar pattern was also observed in the vested benefits solutions.

Our dividend strategy had a more difficult month (Revo Dividends with -2.0% in September). Although the annual return on this solution is still around +8%, the performance of individual stocks dragged down the overall performance. Noteworthy in this context was the collapse of Swiss packaging specialist SIG Group. Following a profit warning and the suspension of the dividend for 2025, the share price plummeted. In our dividend strategy, we require that a substantial dividend payment be made.

With the trend toward additional, sustainable energy sources and infrastructure in connection with the boom in data centers, our decarbonization strategies performed excellently in September. Annual returns are now +7.6% (DecarbRevo3, max. 60% equities) and +9.7% (DecarbRevo5, max. 100% equities).

Strategies mainly based on individual titles Strategy performance*
September 2025 YTD 2025
Zugerberg Finanz R1 –0.2% +1.0%
Zugerberg Finanz R2 –0.3% +1.4%
Zugerberg Finanz R3 –0.3% +1.9%
Zugerberg Finanz R4 –0.4% +2.0%
Zugerberg Finanz R5 –0.6% +1.9%
Zugerberg Finanz RDividends –1.6% +8.6%
Zugerberg Finanz Revo1 –0.4% +1.3%
Zugerberg Finanz Revo2 –0.5% +1.6%
Zugerberg Finanz Revo3 –0.5% +2.4%
Zugerberg Finanz Revo4 –0.5% +2.4%
Zugerberg Finanz Revo5 –0.7% +2.8%
Zugerberg Finanz RevoDividends –2.0% +7.9%
Zugerberg Finanz DecarbRevo3 +1.9% +7.6%
Zugerberg Finanz DecarbRevo4 +2.1% +8.7%
Zugerberg Finanz DecarbRevo5 +2.3% +9.7%
Zugerberg Finanz Vested benefits Strategy performance*
September 2025 YTD 2025
Zugerberg Finanz Vested benefits R0.5 –0.1% +0.4%
Zugerberg Finanz Vested benefits R1 –0.1% +1.3%
Zugerberg Finanz Vested benefits R2 –0.1% +1.6%
Zugerberg Finanz Vested benefits R3 –0.2% +2.9%
Zugerberg Finanz Vested benefits R4 –0.4% +2.8%
Zugerberg Finanz 3a pension solution Strategy performance*
September 2025 YTD 2025
Zugerberg Finanz 3a Revo1 –0.4% +1.3%
Zugerberg Finanz 3a Revo2 –0.5% +1.6%
Zugerberg Finanz 3a Revo3 –0.5% +2.4%
Zugerberg Finanz 3a Revo4 –0.5% +2.4%
Zugerberg Finanz 3a Revo5 –0.7% +2.8%
Zugerberg Finanz 3a RevoDividends –2.0% +7.9%
Zugerberg Finanz 3a DecarbRevo3 +1.9% +7.6%
Zugerberg Finanz 3a DecarbRevo4 +2.1% +8.7%
Zugerberg Finanz 3a DecarbRevo5 +2.3% +9.7%
* The stated performance is net, after deduction of all running costs, excluding contract conclusion costs

Macroeconomics

Strong real economic growth likely to continue in 2026

OECD economists forecast real growth of +3.2% for the global economy in the current year, which is likely to slow only slightly in the coming year. Growth in India is outstanding, while the US and large parts of Europe are likely to grow at roughly the same pace. In Europe, Spain is leading the way in attracting new industrial companies with growth of around +3%, thanks in part to its forward-looking energy policy.

Read more Close
The most important macroeconomic indicators at a glance (Graphic: Zugerberg Finanz)

Global growth rates are significantly higher than had been forecast six months ago. Moderate inflation rates, falling prices on the global energy and commodity markets, improved financing conditions, and, in particular, the weaker US dollar are fueling growth in numerous emerging markets. India is benefiting not only from its young human capital, but also from the trend toward multi-shoring.

China’s state-owned enterprises remain in poor shape, and numerous infrastructure investments made in the past are proving to be financial black holes, leaving provincial and municipal governments deeply in debt. The construction industry is still in a depressed decline. In contrast, private companies are rapidly gaining new customers and new markets.

China demonstrated its strength in the field of AI many years ago with its immense mainframe computing capacities. Digitalization is much more advanced than in Europe or the US. The gap is now narrowing even in the last few areas of Western market leadership, including semiconductor production, for example.

In numerous other areas – including renewable energies, electric vehicles, and robotics – global dominance is evident. Let’s take a look at industrial robotics as an indicator of industrial automation and performance: Last year, 542,000 robots were put into operation around the globe, 54% of them in China, 20% in the rest of Asia, 16% in Europe, and 9% in the US. In China alone, two million robots are now installed. Western suppliers such as ABB have suffered massive losses in market share.

Fierce price wars in the Chinese domestic market are creating enormous pressure to innovate among primarily domestic competitors. Falling prices are adding to the pressure. This is now also evident in mechanical engineering, where European industry was traditionally very well positioned.

At the world-famous Hannover Messe trade fair, there were only 500 Chinese exhibitors in 2014; now there are three times as many. By the time the People’s Republic celebrates its centenary in 2049, China wants to be a technology leader, perhaps even the global technology leader. The dispute with the US is accelerating the national forces of “self-empowerment.” The apprentice is outdoing his master in more and more areas.

At the same time, the Chinese are surprised at how Europe, for example, is weakening its own competitiveness and the management of its own manufacturing supply chains through regulation. For example, the most efficient diesel engines are being banned and the safest nuclear power plants (thanks to Siemens technology) are being shut down. In addition, energy-intensive industries such as basic chemicals are being deliberately led into the abyss by a misguided energy policy.

Region 3–6 months 12–24 months Analysis
Switzerland We are well on the way to copying the EU's worst mistake: overregulation, even though competition systems and markets are being deregulated.
Eurozone, Europe Regaining competitiveness also requires acknowledging the need to reform the framework conditions for more dynamic economic activities.
USA The US is only managing to develop specialized, globally competitive companies in very few sectors.
Rest of the world The rapid learning and adaptation capabilities, particularly in Asia, are repeatedly underestimated. Or are we in the Western world simply too slow?

Liquidity, currency

The cycle of key interest rate cuts is almost complete

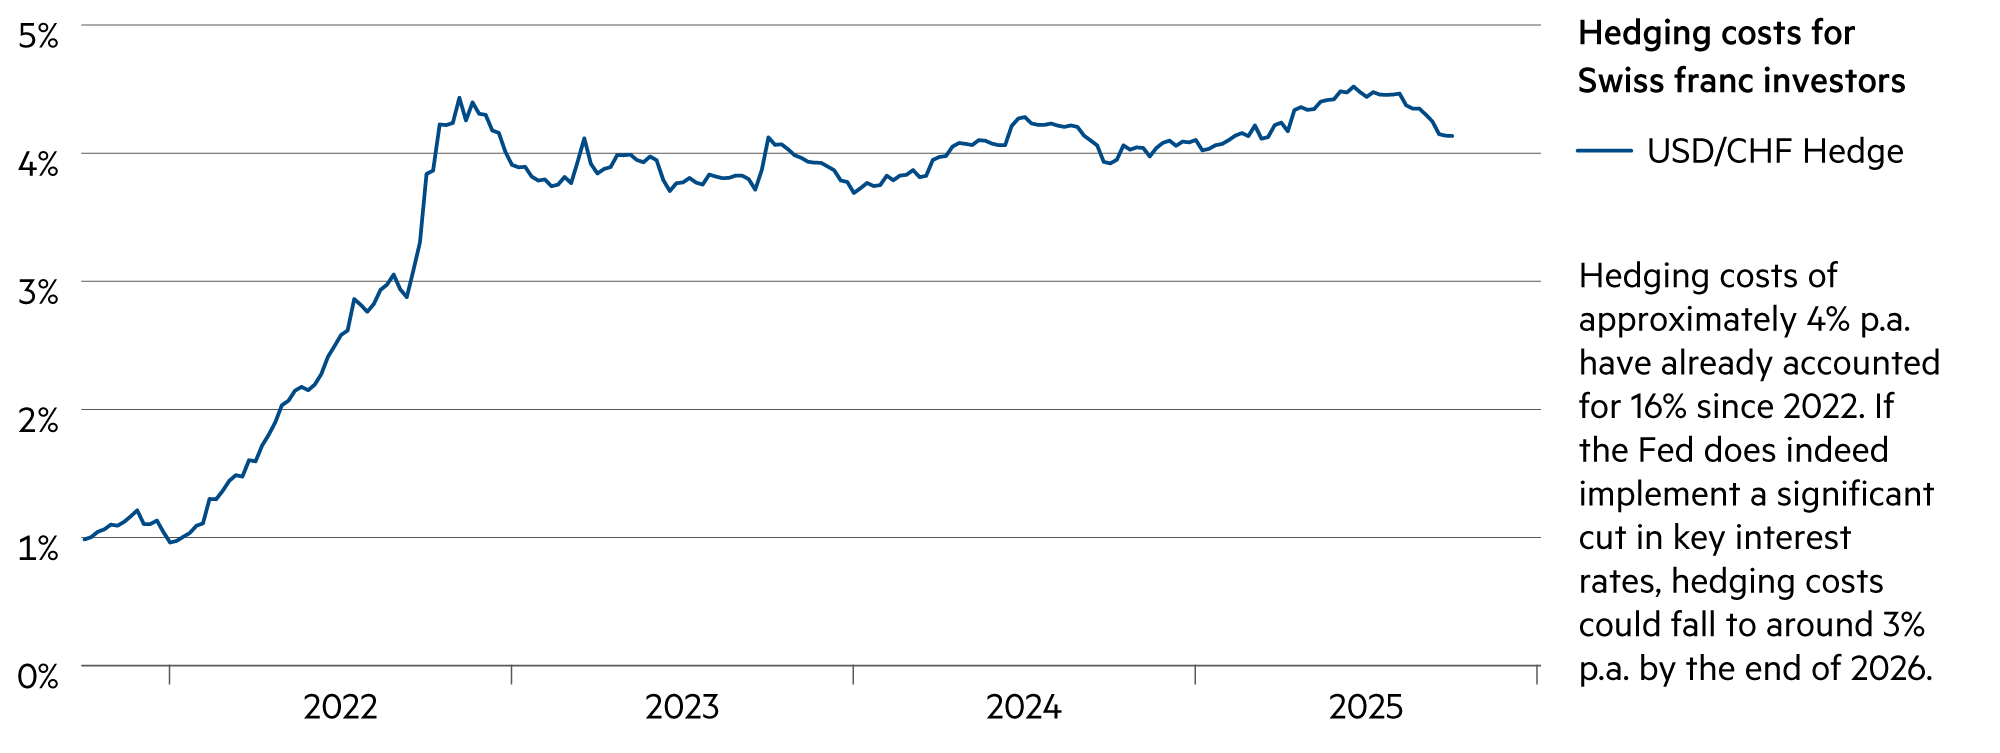
After sharp, inflation-driven increases in key interest rates from spring 2022 onwards, the peak was already reached in fall 2023. The first cuts in key interest rates began in 2024. This cycle is largely complete in Switzerland and the eurozone. Only in the US do we expect a further cut of around 4% to around 3% in the coming 12 months.

Read more Close
Central bank interest rates from 2021 until the end of 2026 (Source: Bloomberg L.P. | Graphic: Zugerberg Finanz)

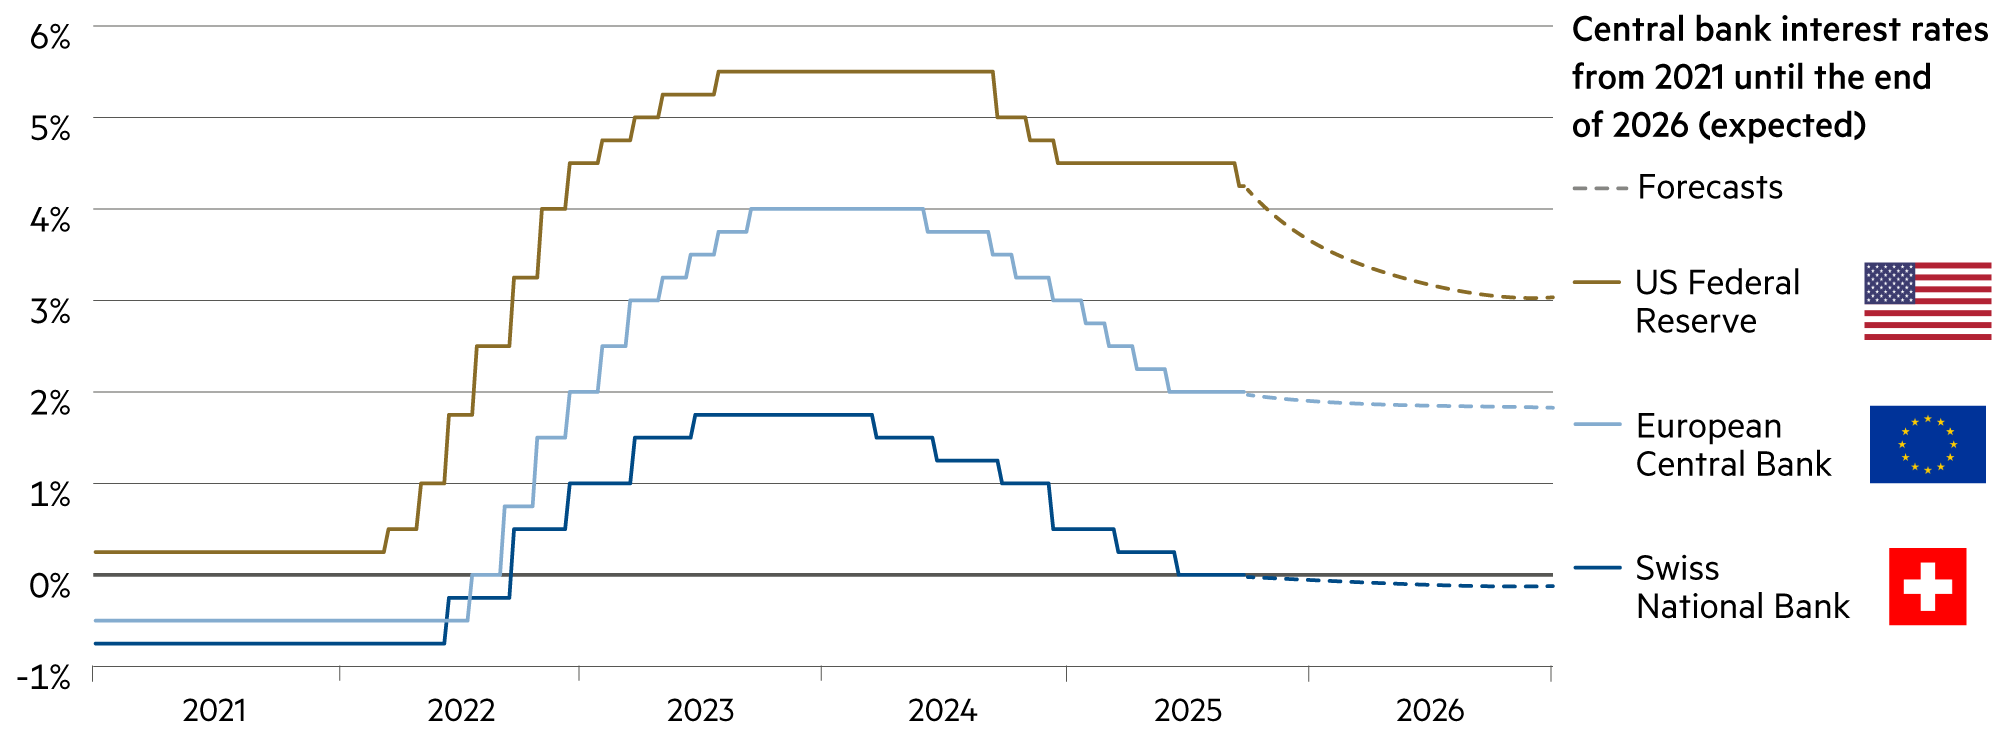
The US Federal Reserve (Fed) continues to pursue a restrictive monetary policy, but in September, after a lengthy pause, it resumed its path toward a neutral key interest rate level. One reason for this is that the labor market is showing signs of weakness. The Fed has a mandate to ensure full employment through its monetary policy.

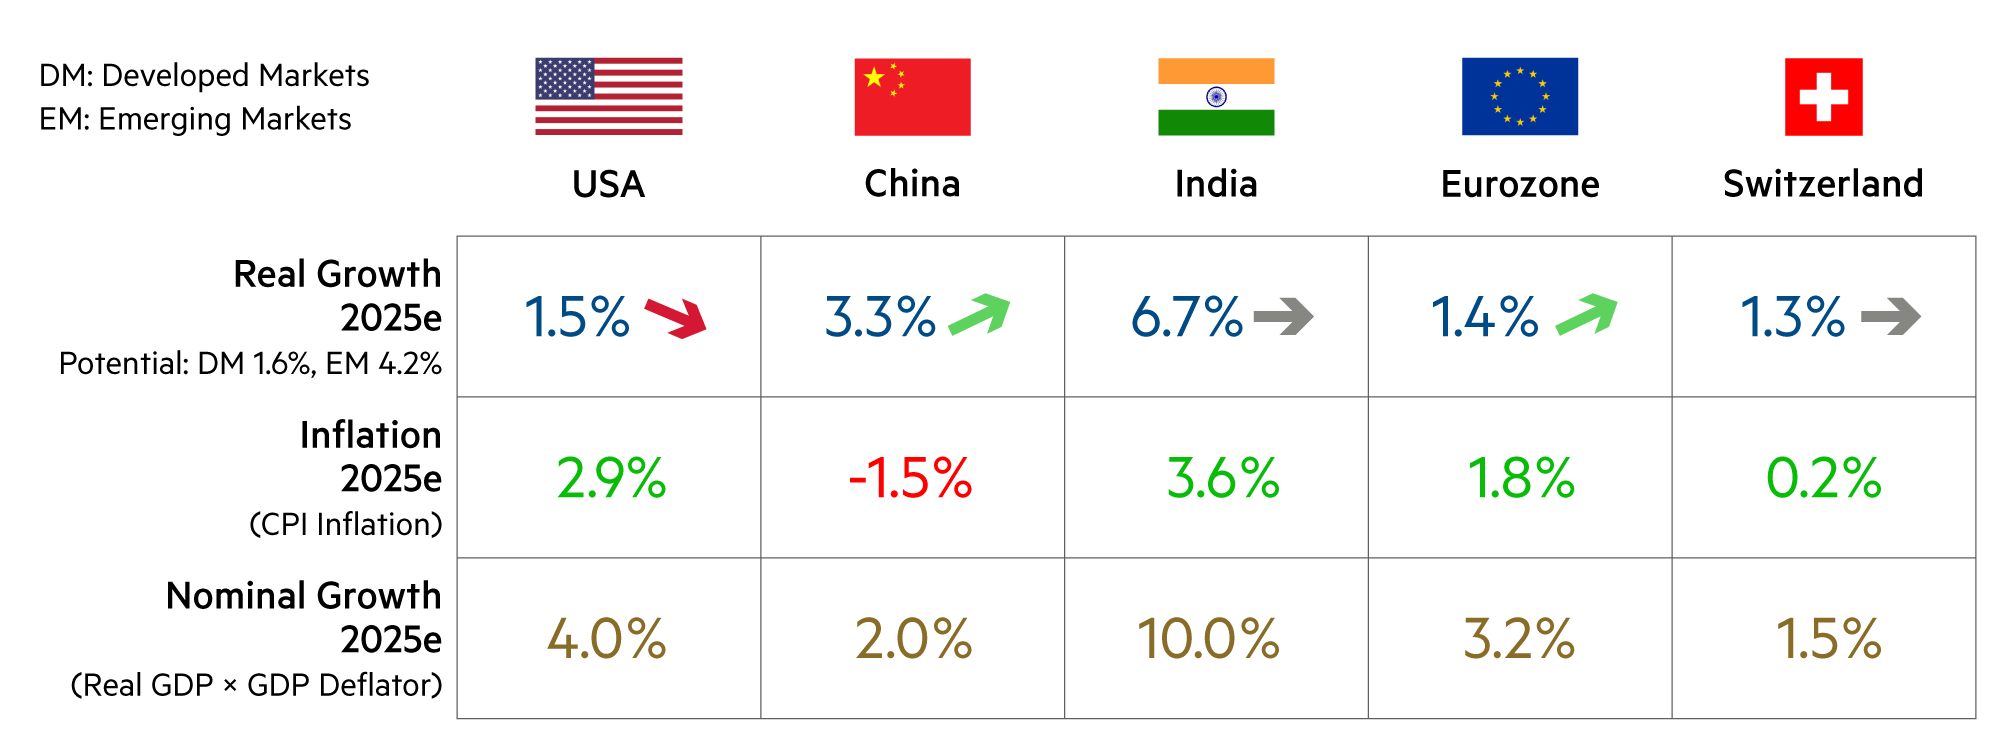
This endeavor has received more attention again at recent meetings. In addition, the inflation rate of 9.0% (June 2022) has fallen rapidly. In August 2025, it was still at 2.9%, with core goods inflation oscillating around 0% over the last twelve months. The main driver of inflation remains housing, and this is precisely what the Fed has control over: when key interest rates fall, housing costs also fall and the inflation rate continues to decline. The pressure from the White House on the long-inactive Fed is therefore entirely justified.

The capital market currently expects four further interest rate cuts in the coming twelve months. This would effectively bring the key interest rate down to 3.1% and would ease a number of conditions, not only in corporate financing (debt capital through bank loans and bonds).

With the Fed’s key interest rates, mortgage rates would also fall, for example, and rental apartments would become cheaper. In addition, leasing rates (currently averaging around 7.5% p.a.) and credit card overdrafts (currently around 22% p.a.) would incur lower interest rates, as would high student loan debts.

More than 50 million young and older people have incurred debt during their college and university years to pay for their expensive education. Many graduates start their professional lives heavily in debt and then struggle to service the interest on their loans and repay the debt.

Currently, outstanding debt amounts to more than $1.8 trillion. Education may be a gateway to social advancement, but for too many people, this promise collapses under the weight of debt.

In other words, the Fed holds the monetary policy key to making life much easier for American households. This is urgently needed, as the middle class is still reeling from the wave of inflation in recent years, which has forced it to dip into its savings to pay all its bills.

In the US, 50% of consumer spending now comes not from the middle class, but from the top 10% of households in terms of income. Specifically, these are households with an annual income of $250,000 or more. The dependence of economic growth in the US on the purchasing power of the rich has never been so high.

Asset class 3–6 months 12–24 months Analysis
Bank account The Swiss National Bank is unlikely to change its key interest rate of 0.0% in the next 12 months. This will also render bank interest rates obsolete.
Euro / Swiss franc Financial stability in the eurozone will only be maintained if growing doubts about the ability to implement reforms can be convincingly countered in the near future.
US dollar / Swiss franc The dollar remains weak, as does, unfortunately, Europe's dependence on hardware and software, data centers, and satellite communications from the US.
Euro / US dollar The euro has gained 13.3% against the dollar since the beginning of the year. At 1.17, it is trading at roughly the average level of the past 25 years.

Bonds

Beware of high coupons

Bonds with high coupons appear attractive at first glance. However, they are usually issued in a foreign currency, such as US dollars or euros. Those who want to avoid currency risks face persistently high hedging costs. To hedge the US dollar against its structural depreciation against the Swiss franc, more than 4% must currently be paid. For the euro, the figure is only slightly more than 2%.

Read more Close
Persistently high hedging costs for Swiss franc investors (Source: Bloomberg | Graphic: Zugerberg Finanz)

We caution against tempting statements. At the beginning of the month, we read in an email from a US bank to its customers: “Government bond yields are at levels not seen since 2008 and offer investors an attractive entry point. With central banks heading for interest rate cuts, falling yields could enable capital gains.” But is such an investment really “attractive” from a Swiss franc perspective?

Firstly, not all central banks are heading for interest rate cuts, as we explained on the previous page. But it is true that we also see further potential for cuts in the US. Secondly, it is very important to note that coupon income is taxable as income.

At a tax rate of 30%, a coupon yield of 5.0% results in a net yield of 3.5%. Thirdly, if you want to hedge the exchange rate risk, this currently costs around 4.2% per annum. However, these costs are not deductible when calculating taxable income. It is therefore clear that, after taking into account the costs of currency hedging and income tax, the 5% dollar bond already yields a return of -0.7% in Swiss francs. Finally, there are also the costs of the custodian bank, etc., which means that we are already deep in negative interest territory.

The hedging costs of approximately 4% p.a. have already amounted to a cumulative 16% since 2022. If the Fed were to actually implement sharp cuts in key interest rates, hedging costs could fall to around 3% p.a. by the end of 2026. But even then, short- and medium-term government bonds should be avoided. The prospects for positive overall returns remain low.

On the other hand, for reasons of (risk and return) diversification, a number of longer-term bonds can and must be included in a portfolio balanced between bonds and equities. These would stabilize the portfolio in the event of a sharp decline in interest rates due to economic conditions through essential price increases. In addition, the price gains then achieved on the bonds are exempt from income tax.

The focus on key interest rates often obscures an important change in the yield curve. This has become much steeper since the beginning of the year. The SNB’s monetary policy has lowered interest rates at the short end of the yield curve by around 40 to 50 basis points.

At the long end, however, various market forces are at work. Interest rates in Switzerland have risen by 20 to 30 basis points since the beginning of the year – an obvious steepening of the yield curve.

Asset sub-class 3–6 months 12–24 months Analysis
Government bonds Ten-year Swiss government bonds yield only +0.1% p.a. At least there is no need to worry about interest tax.
Corporate bonds In a low interest rate environment, corporate bonds offer a relatively attractive yield premium compared to government bonds. Disciplined selection is required.
High-yield, hybrid bonds Subordinated and high-yield corporate bonds provide above-average returns and enrich our multi-asset class portfolios.

Zugerberg Finanz bond solutions

Corporate bonds generate positive returns

Our bond solutions include a conservative option characterized by long-term bonds with very high credit ratings and a yield-oriented option that focuses primarily on attractive coupon yields from good debtors. Both solutions generate positive returns in the portfolios. At the end of September, the Credit Opportunities Fund (COF) stood at an all-time high of 138.9. The fund was launched just under 13 years ago with an initial value of 100.0 per fund unit.

Read more Close
COF vs. SBI AAA-BBB (Total Return) since inception in November 2012 (Source: Bloomberg | Graphic: Zugerberg Finanz)

Corporate bonds are attractive in the current market environment, while government bonds are hardly profitable anymore. Ten-year Swiss government bonds currently yield 0.1% per annum. These are meager prospects, whereas a disciplined selection of corporate bonds can generate significantly higher returns.

History illustrates this. The Swiss Bond Index (AAA-BBB Total Return) represents the best segment of the Swiss franc capital market – a combination of government and cantonal bonds, mortgage bonds, and high-quality corporate bonds. Over the past 13 years, the index has generated a cumulative return of just +11.5%. If you deduct the costs of an index product, you would end up with a return of around +0.6% per year.

In contrast, we have been focusing on corporate bonds for 13 years, often on the threshold between a BBB and a BB rating. With this approach, our clients have benefited from a rise in the price of fund units from CHF 100.0 to CHF 138.9. The increase of +38.9% corresponds to an annual return of +2.6%. The longer you remain invested, the stronger the compound interest effect becomes.

In the current year, the return to date is +3.4%. In the conservatively oriented Zugerberg Income Fund (ZIF), with which we aim to outperform the Swiss Bond Index (SBI) over a longer period, the return after all costs and fees is +1.8%. This is significantly higher than the SBI, which has achieved a return of +0.5% so far this year, excluding costs.

The ZIF has recently added corporate bonds that will secure a solid return for many years to come. These include bonds from Swiss Life, Implenia, Groupe E, and Danaher (12-year CHF bond with a yield of around 1.6%, 20-year CHF bond with a yield of 1.9%).

The first bond issue by the newly formed Cham Swiss Properties was also included, which will yield interest of 1.4% per annum over the next five years. The debtor is a real estate company with attractive growth potential in prime locations and a relatively high residential component (60%) as well as a conservative financing structure with a high equity ratio (61%). The shareholder structure is characterized by entrepreneurial, long-term anchor shareholders such as the families of Philipp Buhofer and Annelies Häcki Buhofer from Zug.

Zugerberg Income Fund Credit Opportunities Fund
Yield in 2025 (since the beginning of the year) +1.8% +3.4%
Yield since the start (annualized) -61% (-0.9%) +38.9% (+2.6%)
Proportion of months with positive yield 57% 68%
Credit risk premium in basis points (vs. previous month) 90 BP (+0 BP) 382 BP (+14 BP)
Average rating (current) A- BB

Real estate, infrastructure

The apparent steepening of the yield

With the steepening of the yield curve, short-term interest rates have fallen significantly since the beginning of the year, while long-term rates have risen noticeably. This means that short-term, money market-based mortgage loans have become cheaper and longer-term loans more expensive. The discount rates used in real estate valuation have been reduced by many appraisers in the current year, which has resulted in higher valuations despite unchanged earnings.

Read more Close
The Swiss swap curve from 30.9.25 vs. the swap curve from 31.12.24 (Source: Bloomberg | Graphic: Zugerberg Finanz)

Higher valuations do not necessarily mean attractive investment opportunities. We currently have little faith in Swiss real estate funds. They offer hardly any returns. Rental income is stagnating for many funds. Due to the reference interest rate, a decline in income is even to be expected for funds with a high residential component.

The focus would therefore have to be on attractive locations with value-creating development prospects. But even then, numerous (large) real estate funds are trading at a high valuation premium to market value. This leads to price-earnings ratios (P/E) of between 40 and 50, measured against expected earnings for the coming year. We consider this too high and it only promises a modest dividend payout of around 2%.

With selected individual real estate stocks, it is possible to achieve a more favorable risk/return profile. With our selection (including Mobimo +13%, PSP Swiss Property +8%), the total return so far this year is noticeably higher than that of the Swiss real estate fund index CHREF (+7.2%). Mobimo’s P/E ratio is 23, while PSP’s is lower. Mobimo is a dividend stock with a high residential component and interesting development potential. Its economic dividend capacity is therefore structurally higher than that of a typical real estate fund. This is also due to the fact that these companies operate with a leverage effect by incorporating debt capital.

Debt capital is currently cheap again. Some companies take out bank loans (mortgage loans). However, it should be noted that bank margins have risen by around 20% in the past twelve months, and even more for commercial real estate.

As a result, real estate companies are increasingly turning to the capital market with regular staggered maturities, thereby stabilizing their debt profile and reducing the corresponding interest rate risks that could affect their annual results.

However, the vast majority do not exceed a loan-to-value ratio of 50%. Long-term real estate loans and bonds currently cost between 1.5% and 2.0%. This makes more sense for investments in a development portfolio than a money market-based solution. In addition, rolling financing also stabilizes the dividend stream, because the path of rental income on the expense side is not thwarted by highly fluctuating interest costs.

Compared to bonds, real estate companies remain attractive, provided they are carefully selected. On the one hand, you participate in economic growth through real value. Low interest rates also favor construction financing and increase the attractiveness of real estate purchases, which in turn stimulates demand.

Asset sub-class 3–6 months 12–24 months Analysis
Residential properties CH The CHREF real estate index reached a new high for the year in September and is clearly up after nine months (+7.2% since the beginning of the year).
Office and retail properties CH The situation remains difficult in many places due to a lack of the necessary regulatory flexibility to enable a smooth transition between living and working.
Real Estate Fund CH The Swiss Real Estate Fund Index (CHREF) has achieved an annual return of +5.8% over the past ten years. This year, a better return is on the cards.
Infrastructure Equity / Fund Many European infrastructure stocks recovered in September, giving rise to justified optimism for the fourth quarter of 2025.

Equity

Swiss market with modest returns in September

The Swiss stock market disappointed in September, but got off to a strong start in the final quarter. In Swiss francs, Swiss equities are still well above the current level of the global stock index (+2.5%). Due to the massive decline of the dollar (-12.2% since the beginning of the year), the latter is at a rather modest level. In contrast, many European stocks are clearly in positive territory, even if their earnings momentum has slowed recently. However, the fourth quarter is always decisive, as it is historically the strongest quarter of the year.

Read more Close
Stock markets since 1 January 2025 (Graphic: Zugerberg Finanz)

September is considered the notorious villain of Wall Street, shaking up the stock market and causing panic among investors – but this year, it did not play that role. Only the Swiss market remained in negative territory (-0.6%). The US S&P 500 (+2.9%) and Nasdaq Composite (+5.0%) significantly outperformed the traditional Dow Jones (+1.3%). European indices also performed largely positively in September.

US stocks experienced their best September in 15 years. This is a surprising turn of events that is now leading investors to wonder whether the rally could continue until the end of the year, even if the warning lights are flashing. We remain confident about the disciplined selection of stocks we hold in our portfolio for the final quarter.

The rally in the US came as investors welcomed the Fed’s decision earlier this month to cut its key interest rate by 25 basis points to a range of 4.00% to 4.25% and to announce two further rate cuts at its remaining meetings this year.

This was accompanied by renewed enthusiasm for artificial intelligence (AI), which gave the stock market – especially megacap technology stocks – a new boost. However, the actual group of companies that will emerge as the next generation of AI winners remains open.

In the US, earnings growth, a sufficiently strong economy, the resumption of the interest rate cut cycle, and continued signs of long-term growth in AI were the key catalysts supporting stocks this month. However, the latest labor market data is disappointing. Strong earnings growth of around +8% year-on-year is already priced into stock prices following the recent rise in the third quarter.

Swiss stocks can also expect seasonal tailwinds in the final quarter. The market is also more broadly based than in the past. On October 1, the market capitalization of the three largest Swiss stocks in the broad Swiss Performance Index was around 12% each for Novartis, Roche, and Nestlé.

Zurich Insurance, ABB, Richemont, and UBS each have a weighting of around 5% to 6%, followed by Swiss Re (3%) and Holcim and Sika (each with around 2%). However, we deliberately deviate significantly from this weighting in our portfolios. As a result, we have outperformed the SMI and SPI seven times in the past ten years.

Asset sub-class 3–6 months 12–24 months Analysis
Equity Switzerland The Swiss stock market is performing extremely well at the start of the final quarter. We remain confident.
Equity Eurozone, Europe It remains unclear whether the relatively high earnings growth priced into stock prices can actually be realized; in our selection, yes.
Equity USA In Swiss francs, Nvidia (+19% since the beginning of the year) leads Google (+14%) and Microsoft (+8%). Apple (-10%) and Amazon (-11%) are still clearly in the red.
Equity Emerging markets In Swiss francs, the MSCI Emerging Markets rose sharply in September (+6%) and is up an impressive +10% since the beginning of the year, reflecting the positive outlook.

Alternative investments

The AI boom is taking on special proportions

The AI boom is increasingly taking place on unlisted markets. However, there are numerous feedbacks into the listed markets, and ultimately it cannot be ruled out that a bubble will form – even stronger than in 2000 during the “Internet 1.0” wave or “dot-com bubble.” The privately held company Open AI recently completed a financing round with a valuation of $500 billion. Nvidia subscribed to Open AI shares for $100 billion.

Read more Close
Modern Data Center (Image source: stock.adobe.com)

This puts Open AI at the top of the list of the most valuable unlisted companies. Number two is SpaceX, the space company founded and run by Elon Musk, with a valuation of $350 billion. A listed AI-related company such as Palantir Technologies is already valued at $440 billion. The US company is expected to generate an estimated $4.2 billion in revenue this year (!).

The share price of US software and database specialist Oracle skyrocketed in September when it announced plans to invest over $100 billion in data centers. At the same time, it was announced that no positive cash flow was expected over the next four years and that a significant portion of the gigantic investment cycle would be financed with debt.

Anyone who fears an AI-related bubble should take another look at the chapter on stocks. In Switzerland, the inflation rate is practically 0%. Government bonds traded in Swiss francs also yield around 0%. Stocks, on the other hand, are generating a return on earnings of around 6%, and this does not even factor in future earnings growth. That is a real return of 6% for stock investors.

In the US, on the other hand, the inflation rate is 3% and the earnings yield for a broad basket of stocks is 4%, meaning that the current real return is only 1%. It has been a long time since investors who are not blinded by hopes for the future but focus primarily on real value appreciation have been able to find comparatively genuine bargains outside the US.

Over the past ten years, the US stock market has been the driving force behind global capital markets, pushing portfolios upward with seemingly endless liquidity and seemingly unstoppable profit growth. Despite already high profit margins, annual profit growth of 11% to 12% will now be required over the next five to six years to justify the current price level economically.

In contrast, the Swiss portion of our stocks in the Zugerberg Finanz portfolios is selected so conservatively that the price levels are justified by the dividend yield of 3% to 4% per annum alone. Expectations for future earnings growth are much more modest than for US stocks and are always sustainably underpinned by substantial free cash flow surpluses from operating activities.

Asset sub-class 3–6 months 12–24 months Analysis
Commodities Crude oil prices have fallen sharply since the beginning of the year (-9% in USD). However, natural gas prices have fallen even more sharply (-30%).
Gold, precious metals Gold (+10% in September) has already achieved strong growth since the beginning of the year (+29% in CHF). There is still no end in sight.
Insurance Linked Securities Our portfolios contain a moderate amount of insurance-related bond risks, particularly in the vested benefits foundations.
Private equity With interest rates falling and economic data improving, the outlook for unlisted companies (and their owners) is also improving.

Summary

Asset class 3–6 months 12–24 months Analysis
Macroeconomics Industrialized countries are also likely to benefit from accelerating growth momentum in emerging markets.
Liquidity, currencies At 1,200 points, the dollar spot index is a full 8.3% lower than all other relevant currencies in the global economy since the beginning of the year.
Bonds With Zugerberg bond solutions, which gained further ground in September, we are significantly above the Swiss Bond Index's return to date.
Real estate, infrastructure Real estate and infrastructure investments, if carefully selected, continue to be an attractive addition to our multi-asset class portfolios.
Equities The start to the fourth quarter has been successful. The best quarter in history means that our year is likely to end with a positive return.
Alternative investments The strategic allocation of high-yield private market investments cushions the volatility of listed securities in an overall portfolio.

Market data

Asset class Price (in local currency) Monthly / YTD / Annual performance (in CHF)
Equity 30.09.2025 09/2025 2025YTD 2024 2023 2022
SMI CHF 12'109.4 –0.6% +4.4% +4.2% +3.8% –16.7%
SPI CHF 16'748.6 –0.9% +8.2% +6.2% +6.1% –16.5%
DAX EUR 23'880.7 –0.2% +19.1% +20.4% +13.1% –16.3%
CAC 40 EUR 7'895.9 +2.4% +6.4% –1.0% +9.6% –13.9%
FTSE MIB EUR 42'725.3 +1.1% +24.1% +14.1% +20.4% –17.3%
FTSE 100 GBP 9'350.4 +0.8% +7.7% +12.1% –0.3% –8.8%
EuroStoxx50 EUR 5'530.0 +3.2% +12.3% +9.6% +12.1% –16.0%
Dow Jones USD 46'397.9 +1.3% –4.5% +22.1% +3.5% –7.7%
S&P 500 USD 6'688.5 +2.9% –0.4% +33.4% +13.1% –18.5%
Nasdaq Composite USD 22'660.0 +5.0% +2.7% +39.2% +30.6% –32.3%
Nikkei 225 JPY 44'932.6 +4.0% +5.2% +15.2% +8.6% –19.7%
Sensex INR 80'267.6 –0.7% –13.4% +13.8% +7.4% –4.8%
MSCI World USD 4'306.7 +2.5% +1.7% +26.6% +10.8% –18.5%
MSCI EM USD 1'346.1 +6.3% +9.6% +13.6% –2.6% –21.5%
Bonds (mixed) 30.09.2025 09/2025 2025YTD 2024 2023 2022
Glob Dev Sov (Hedged CHF) CHF 152.6 +0.2% –0.4% –1.4% +2.2% –13.2%
Glob IG Corp (Hedged CHF) CHF 187.9 +0.8% +2.7% –0.8% +4.2% –16.7%
Glob HY Corp (Hedged CHF) CHF 375.1 +0.3% +4.1% +6.1% +8.7% –13.6%
USD EM Corp (Hedged CHF) CHF 284.6 +0.7% +4.7% +2.4% +4.5% –18.2%
Government bonds 30.09.2025 09/2025 2025YTD 2024 2023 2022
SBI Dom Gov CHF 188.2 +1.4% +0.7% +4.0% +12.5% –17.0%
US Treasury (Hedged CHF) CHF 139.0 +0.5% +1.9% –3.8% –0.5% –15.0%
Eurozone Sov (Hedged CHF) CHF 177.5 +0.3% –1.5% –0.8% +4.8% –18.9%
Corporate bonds 30.09.2025 09/2025 2025YTD 2024 2023 2022
CHF IG Corp (AAA-BBB) CHF 192.7 +0.1% +0.9% +5.1% +5.7% –7.5%
USD IG Corp (Hedged CHF) CHF 190.4 +1.1% +3.5% –2.4% +3.5% –18.5%
USD HY Corp (Hedged CHF) CHF 631.3 +0.4% +3.8% +3.7% +8.5% –13.7%
EUR IG Corp (Hedged CHF) CHF 169.6 +0.2% +1.0% +2.0% +5.9% –14.1%
EUR HY Corp (Hedged CHF) CHF 311.3 +0.3% +2.9% +5.4% +9.8% –10.9%
Alternative investments 30.09.2025 09/2025 2025YTD 2023 2022 2021
Gold Spot CHF/kg CHF 98'805.9 +10.4% +29.0% +36.0% +0.8% +1.0%
Commodity Index USD 104.6 +1.2% –7.3% +8.3% –20.4% +15.1%
SXI SwissRealEstateFunds TR CHF 2'877.0 –0.6% +6.0% +16.0% +5.4% –17.3%
Currencies 30.09.2025 09/2025 2025YTD 2024 2023 2022
US dollar / Swiss franc CHF 0.7964 –0.5% –12.2% +7.8% –9.0% +1.3%
Euro / Swiss franc CHF 0.9345 –0.1% –0.6% +1.2% –6.1% –4.6%
100 Japanese yen / Swiss franc CHF 0.5384 –1.1% –6.6% –3.4% –15.4% –11.0%
British pound / Swiss franc CHF 1.0709 –0.9% –5.7% +6.0% –4.2% –9.3%
Back to News