Monthly Report 01/2026

Publications

Robust economic outlook

Despite fierce trade and geopolitical tensions in 2025, the global economy grew by around 3%. Thanks to loosened monetary policy and reduced trade uncertainties, the economic outlook is expected to remain robust despite fragile geopolitical stability. This is complemented by economic reforms and the expansion of the beneficiaries of technological innovations.

Emerging markets in particular, which, like South Korea and Taiwan, have made significant strides in digitalization and automation and significantly improved their investment climate, are likely to drive growth. They have been growing significantly faster than industrialized countries for many years and now contribute over 60% to global GDP growth.

The adoption of a wide range of AI applications, including in emerging markets, is ensuring that productivity improvements are increasingly distributed globally. Value creation is increasingly spreading beyond the disruptive pioneers in the US. The rapid adoption of AI in transformative innovations is certainly a growth driver in Asia, but increasingly also in Europe.

In contrast, more and more companies in the US are struggling with the financing risks of AI dynamics. They increased investment by 50% to 70% in 2025, with an additional 15% to 30% planned for 2026. Circular investments create a lack of transparency about the true extent of AI demand underpinned by willingness to pay. What is clear is that the purchasing power of private households remains under pressure, as does the labor market (rising unemployment, falling real wages). This is because the AI boom has not yet led to job growth.

2025 closed with positive returns

The portfolios rose slightly again in December, meaning that all solutions closed the calendar year with a positive return. Some decisions were right, some were wrong. Above all, we missed out on the precious metal rally of gold (+50% in CHF) and silver (+160%), while “digital gold” Bitcoin (-20%) slipped noticeably.

The return on balanced strategies (Revo3) was +3.8%. The return on the equity-focused Revo5 was +5.2%. Dividend-oriented solutions achieved a great year-end result (+12.3%). These have also been available in tied pension plans (vested benefits, 3a) since 2025.

To put these returns into perspective, we would like to point out various benchmarks. Passive bond strategies yielded hardly any returns in 2025. The Swiss Bond Index (AAA-BBB Total Return) ended the year slightly down (-0.1%), while the global bond index ended slightly up (+0.3%, hedged in CHF). Our bond solutions achieved higher returns. The conservative Zugerberg Income Fund ended 2025 on a convincing note (+1.4%), while the more risk-tolerant Credit Opportunities Fund (+3.4%) achieved annual results in line with our high expectations.

The Swiss Market Index (+14.4%) significantly outperformed, while the US indices tended to disappoint in 2025. Some of these are even down (Dow Jones -0.9% in CHF) or only moderately up (S&P 500 +2.1%, Nasdaq +5.2%). This also affected the performance of the global equity index, which is dominated by US equities (over 71%). The annual return for 2025 of the MSCI World global equity index (+4.8% in CHF) is roughly in line with the performance of the Revo 5 solution, while that of dividend-oriented strategies is roughly in line with the SMI.

Strategies mainly based on individual titles Strategy performance*
December 2025 2025
Zugerberg Finanz R1 –0.2% +1.6%
Zugerberg Finanz R2 +0.3% +2.8%
Zugerberg Finanz R3 +0.4% +3.8%
Zugerberg Finanz R4 +0.6% +4.2%
Zugerberg Finanz R5 +0.7% +4.4%
Zugerberg Finanz RDividends +2.2% +14.1%
Zugerberg Finanz Revo1 –0.5% +1.8%
Zugerberg Finanz Revo2 +0.0% +2.8%
Zugerberg Finanz Revo3 +0.2% +4.0%
Zugerberg Finanz Revo4 +0.2% +4.5%
Zugerberg Finanz Revo5 +0.4% +5.5%
Zugerberg Finanz RevoDividends +1.9% +12.7%
Zugerberg Finanz DecarbRevo3 –1.1% +11.2%
Zugerberg Finanz DecarbRevo4 –1.1% +13.7%
Zugerberg Finanz DecarbRevo5 –1.1% +15.8%
Zugerberg Finanz 3a pension solution Strategy performance*
December 2025 2025
Zugerberg Finanz 3a Revo1 –0.5% +1.8%
Zugerberg Finanz 3a Revo2 +0.0% +2.8%
Zugerberg Finanz 3a Revo3 +0.2% +4.0%
Zugerberg Finanz 3a Revo4 +0.2% +4.5%
Zugerberg Finanz 3a Revo5 +0.4% +5.5%
Zugerberg Finanz 3a RevoDividends +1.9% +12.7%
Zugerberg Finanz 3a DecarbRevo3 –1.1% +11.2%
Zugerberg Finanz 3a DecarbRevo4 –1.1% +13.7%
Zugerberg Finanz 3a DecarbRevo5 –1.1% +15.8%
* The stated performance is net, after deduction of all running costs, excluding contract conclusion costs

Macroeconomics

Real global economic growth of 3%

The global economy is expected to grow by around 3% in real terms in 2026. However, Western industrialized countries will contribute little to this growth. The lion’s share will come from emerging markets, with India leading the way with an estimated real growth rate of 7%. The US is currently losing competitiveness, both in the battle for future technologies and in the battle for talent. In addition, the world’s largest economy is struggling with rising unemployment, tariff-induced inflation and declining consumer confidence.

Read more Close
(Image source: stock.adobe.com)

The current global economic cycle is strongly influenced by artificial intelligence (AI) and other technologies that will have a huge impact on a wide range of areas: we have only just begun to gain experience from numerous examples in the fields of mobility, health, and education.  And these show that AI-driven innovations have ushered in a new, rapid cycle of competition worldwide.

We are gradually seeing how White House policy is affecting this development. For the first time in its 250-year history, immigration policy in the US has a negative balance. Yet it was precisely the large tech companies that were dependent on the immigration of highly qualified specialists. Immigration is a recipe for success for innovation in the US, and working extremely hard is part of the mentality. Most founders of tech companies are immigrants or children of immigrants. But currently, the trend is moving in the opposite direction. Universities are also no longer able to attract and retain the best people from around the world. Almost every university is seeing a decline in the number of applicants from abroad.

In many areas, European universities have more knowledge and more appeal. If Europe could also succeed in curbing its regulatory culture, promoting innovative start-ups and strengthening entrepreneurship, there would be real hope for a sustainable economic upturn. Two dozen US tech companies have already set up shop in the Zurich area to recruit human resources here. Google has its largest research center outside Silicon Valley in Zurich, with around 6’000 employees, Apple in Munich, and others in Berlin, London, or Paris.

The global economy will not be about tariffs or international law, nor will it be about key interest rates or global trade flows. What will be decisive is where the (highly) skilled workers are and where they want to go, where they want to shape their lives inside and outside a company. That is why European companies such as Siemens, Schneider Electric, and ABB, with their liberal corporate culture, have a real chance of becoming and remaining global leaders.

China remains a stress factor for the global economy as it increasingly focuses on technological self-sufficiency. The domestic market remains weak. Prices and wages are trending downward, as are real estate valuations. In this deflationary environment, overcapacity is leading to cutthroat price competition, which is also affecting export markets.

Region 3–6 months 12–24 months Analysis
Switzerland Real GDP growth in the range of 1.2% to 1.5% is realistic, with inflation barely noticeable.
Eurozone, Europe Inflation in the eurozone is likely to stabilize at below 2%. GDP growth in France and Germany will be higher, while growth in southern Europe will be lower.
USA With real GDP growth of 2.0%, our estimates are slightly above the consensus. Many expect a more pronounced slowdown.
Rest of the world China is imploding internally (deflation and unemployment) and growing thanks to unchecked export growth, especially to Europe and the Global South.

Liquidity, currency

The declining purchasing power of the dollar

Since the beginning of the year, the euro has fluctuated within a narrow range against the Swiss franc. This new stability is welcome, as it compensates for the instability and increasing volatility of the dollar. The latter is linked to numerous monetary and fiscal policy uncertainties, while the eurozone is proving to be legally secure and stable in terms of value.

Read more Close
Purchasing Power of the U.S. Dollar (Source: U.S. Bureau of Labor Statistics I Graphic: Zugerberg Finanz )

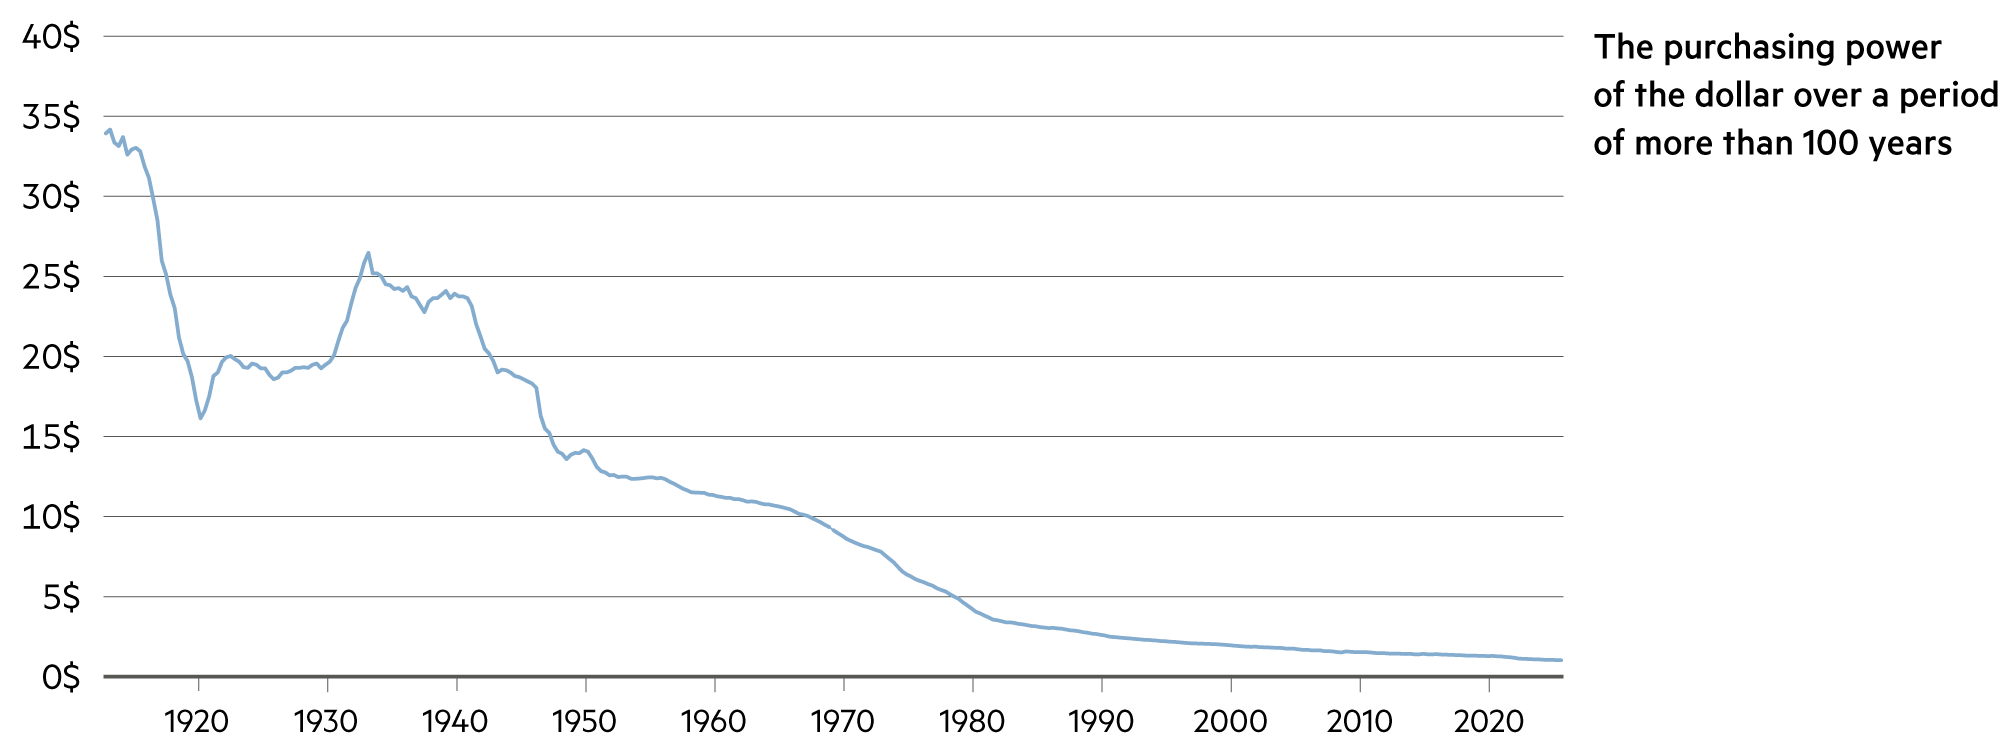
In 1910, one dollar could still buy 30 Hershey chocolate bars (his Swiss ancestors were called Hirschi, but the name was changed in the US). Today, a milk chocolate bar at Walmart costs $1.82 – 55 times more. Conversely, it can be calculated that more than 98% of purchasing power has been destroyed in just over a century. Today, $1.00 corresponds to less than $0.02 in purchasing power.

Since the introduction of flexible exchange rates in 1971, the dollar has also suffered severe losses in its external value: -81.4%. Initially, one had to pay 4.30 francs for one dollar, today it is only 79 centimes. There is another component to this loss of purchasing power. We must continue to expect an annual loss in value of 3%. However, the trend is unlikely to be linear. This could lead to the idea of hedging the currency. This currently costs 3.8% per annum. In 2024, it would not have been worthwhile, but in 2025 it would have been. Whether it will be worthwhile in 2026 is difficult to predict.

The lower currency hedging costs against the euro (approx. 2.1%) reflect more sustainable fiscal and monetary policy as well as lower inflation and interest rate differentials. In the case of the dollar, the political crisis of confidence in 2026 could prevent it from bottoming out. In the past, the dollar has always weakened when the Fed has cut interest rates and the US has not been in recession. In addition, markets could further strengthen their expectations of multiple interest rate cuts by the Fed in 2026 with the appointment of a new Fed chair who is loyal to Trump. This is compounded by questions about the Fed chair’s ties to the White House. This could lead to further currency depreciation.

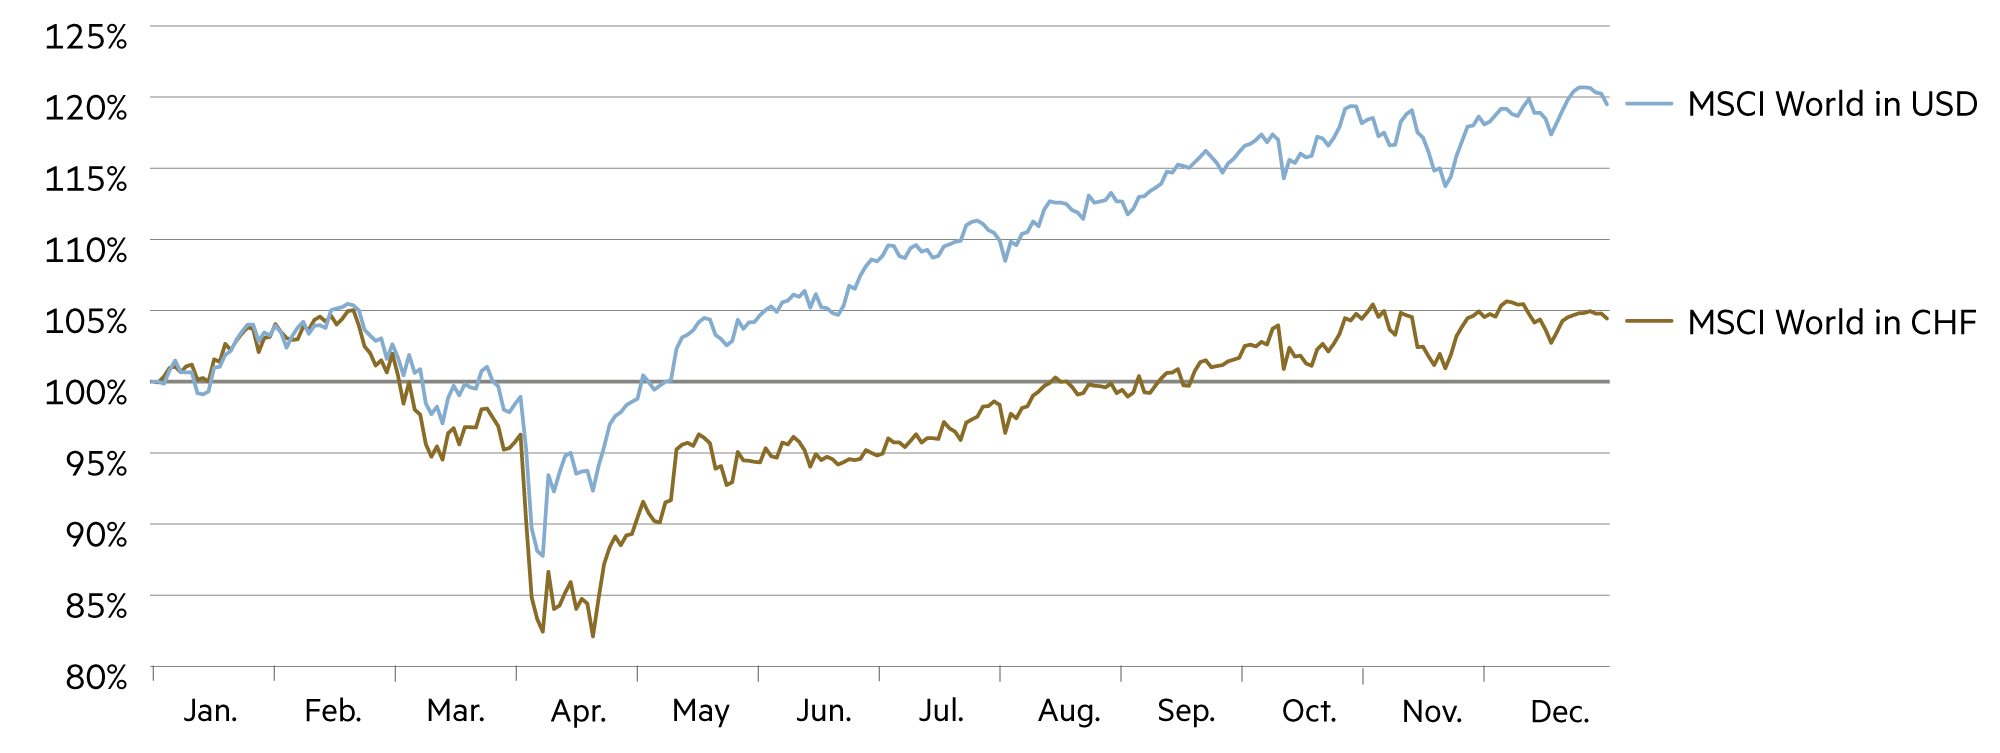
In this context, it is important to consider whether you are looking at things from a dollar or a franc perspective. Last year, the US stock markets rose impressively, but the returns converted into francs looked modest. The Dow Jones (with stocks such as Nvidia, Apple, Amazon, Microsoft, Salesforce, and Cisco) rose +13.0% in dollars. In Swiss francs, this resulted in a return of -1.3% (!). The Nasdaq technology index (+20.2% in USD) performed less well in Swiss francs (+5.0%) than the Swiss SMI (+14.1%). And the broad S&P 500 index from the US (+16.1% in USD) translates into a meager +1.0% (in CHF).

The Chinese currency also performed poorly, meaning that the Hong Kong-traded Hang Seng Index (+13.8% in CHF) and the Shanghai/Shenzhen Index CSI 300 (+12.2%) did not generate exceptional returns either – and this in a year that dealt US tech giants a significant blow with DeepSeek. They had to learn quickly that technological competition is not limited to the players in Silicon Valley.

Asset class 3–6 months 12–24 months Analysis
Bank account Inflation is likely to remain at the lower end of the SNB's target range. Further interest rate cuts are not expected. Bank accounts no longer earn interest.
Euro / Swiss franc In 2025, the EUR/CHF moved mostly sideways. The ECB and SNB are leaving their key interest rates unchanged, so the interest rate differential remains stable.
US dollar / Swiss franc Due to the expected interest rate cuts, the USD is likely to weaken further in 2026 if inflation remains high.
Euro / US dollar The EUR/USD appreciated strongly in 2025. In 2026, we see only limited upside potential for the euro.

Bonds

US tech companies are getting into debt

The largest corporate bonds to hit the market last year were issued by US tech companies. This is linked to the enormous investments in data centers, which can no longer be financed solely from generated cash flow. We are entitled to be somewhat skeptical about this, as there is no proof yet that all of these investments can be monetized and made profitable.

Read more Close
Interest costs of bonds issued by US tech companies; data as at 31 December 2025 (Source: Bloomberg L.P. | Graphic: Zugerberg Finanz)

At the beginning of the year, investors look at the year as a whole and its prospects. In the bond market, they look at the entire yield curve and how it is changing. Is it becoming steeper or flatter, and by how much? Currently, there is less concern about repayments than about the volume of new bond issues. If government budget deficits rise, as is the case from the US to Europe to India and China, a record volume of government bonds is to be expected. The US Treasury bond market alone has doubled since 2018 to over $30 trillion.

Within Europe, some countries are pursuing a sound budgetary strategy. As a result, fewer issues are expected from heavyweights Italy and Spain, and the volume of issues is also likely to decline in smaller countries such as Portugal, Greece, and Ireland. In contrast, Germany’s volume is increasing as a result of its expansionary fiscal policy in favor of renewing its vulnerable infrastructure and improving its defense capabilities. If the government could decide on urgent reforms as quickly as it takes on new debt, not only Germany but the whole of Europe would be much further ahead.

It is impossible to predict how the market will react to the flood of emissions in the new year. It is entirely conceivable that Germany’s ambitious economic stimulus program will get off to a surprisingly good start, in which case the supply of bonds will be eagerly snapped up. Conversely, it cannot be overlooked that the long-term trend in government debt in both industrialized and emerging countries is not very encouraging and carries the risk of rising credit risk premiums. The same applies to Germany: a government without the power to reform is considered a risk.

Ten-year US government bonds are currently yielding 4.1% in dollars. However, currency hedging against the Swiss franc costs 3.8% per annum, meaning that the net yield prospect is practically zero. Those hoping for lower long-term interest rates in the US could, however, benefit from price gains in the coming quarters. Investment opportunities could increase significantly with long-term bonds if inflation and interest rate expectations move in the “right” direction.

From a fundamental perspective, corporate bonds offer greater potential for value. In addition to government bond yields, they carry a company-specific risk premium. Popular US technology companies have solid balance sheets and, in many cases, very high credit ratings. This often results in premiums of only 40 to 90 basis points (bp) over government bonds. The longer the term, the higher the premium. This means that a 25-year bond from Microsoft, Alphabet, or Apple yields around 5.2%, while one from IBM yields 5.7%. If confidence is lost, the premium quickly jumps. Despite its good rating, Oracle has to accept a risk premium of 160 BP.

Asset sub-class 3–6 months 12–24 months Analysis
Government bonds Staatsanleihen The inflation differential between the US and the eurozone makes it difficult to issue new US Treasury bonds at a significantly lower interest rate than at present.
Corporate bonds This is an exciting and challenging investment segment that is worth investing in if you follow a disciplined, selective approach.
High-yield, hybrid bonds The performance of this segment is closely linked to economic developments (which are currently positive). Therefore, a certain degree of risk tolerance is worthwhile.

Zugerberg Finanz bond solutions

Solid returns achieved in 2025

Our bond solutions proved their worth in 2025, generating solid positive returns. As expected, the Zugerberg Income Fund (+1.3%) returned slightly less than the more risk-tolerant Credit Opportunities Fund (+3.4%). This is by no means a given, as the Swiss yield curve steepened significantly last year. At the short end, interest rates fell slightly into negative territory, while at the long end, yields are significantly higher than a year ago.

Read more Close
Swiss yield curve on 31 December 2024 compared with 31 December 2025 (Source: Bloomberg L.P. | Graphic: Zugerberg Finanz)

The Swiss Bond Index (AAA to BBB Total Return Index), which represents bonds on the Swiss franc capital market, ended 2025 slightly down (-0.1%). In general, however, investors are more inclined to consider increasing their exposure to corporate bonds than to government bonds, which offer hardly any return.

With our active bond solutions based on corporate bonds, we significantly outperformed the passive index solution. Even more impressive is that this was achieved with lower volatility, meaning that our solutions delivered impressive risk-adjusted returns in the bond segment.

The interest rate structure on the capital market changed significantly last year. The steepening is evident on both sides. At the short end, interest rates are around 48 basis points lower than a year ago following two interest rate cuts by the Swiss National Bank. Market forces are at work at the long end. Yields are already higher than a year ago for bonds with a maturity of two years or more. For 30-year bonds, the yield is 50 basis points higher per annum. It was precisely this interest rate sensitivity that led to sharp price declines on longer-term bonds.

With the slightly more risk-tolerant Credit Opportunities Fund (COF), investors are investing in companies whose ratings are not top notch. However, the average time to maturity is around three years. Interest rate changes play a minor role. And with over 200 bonds, the fund is highly diversified. If a single company gets into trouble, it does not immediately drag the entire fund down with it.

After 13 years, the COF in particular has achieved impressive returns, adjusted for price fluctuations (volatility), compared to the Swiss Bond Index: the risk/return ratio is significantly better. The bonds recover much more quickly after price slumps.  This has also been evident over the past five years. The key interest rate hikes of 2022 caused the sharpest slump in bond prices in 50 years. The Swiss Bond Index has still not fully recovered from this. The COF, on the other hand, is around 8% above the level of five years ago. A certain degree of risk tolerance is worthwhile, especially if you are then able to weather the price slumps.

For diversification purposes, we also use the Infrastructure Debt Fund from AWI Investment Foundation. With a return of +1.6%, the fund clearly outperformed the Swiss Bond Index last year with moderate volatility.

Zugerberg Income Fund Credit Opportunities Fund
Yield in 2025 (since the beginning of the year) +1.3 +3.4
Yield since the start (annualized) -6.5% (-0.9%) +38.9% (+2.5%)
Proportion of months with positive yield 57 68
Credit risk premium in basis points (vs. previous month) 93 BP (-1 BP) 408 BP (-4BP)
Average rating (current) A BB+

Real estate, infrastructure

Infrastructure on the rise

We achieved very positive total returns with infrastructure companies last year. In the current year, we expect further profit increases and rising dividend yields that are above the average for the broad stock market. The upside potential is far from exhausted, as favorable valuations justify at least a partial revaluation thanks to less volatile business models and unbroken demand for data centers.

Read more Close
A data centre in Switzerland (Image source: Implenia)

From an investor perspective, we continue to view infrastructure stocks such as Engie (+43% price change in CHF over the past year), Veolia (+11%), and E.ON (+39%) as attractive. We will also hold on to BKW (+6%) and strengthen our infrastructure portfolio with Enel, as the growth outlook remains excellent. Demand for data centers remains unbroken. These place special demands on power generation and distribution. The focus is on high energy efficiency, stability, and security of supply at market-driven prices.

State-of-the-art data centers form the backbone of our economy – for financial services, technology, and research, as well as for electromobility and self-driving cars, among other things. At the same time, Europe is benefiting from deregulated electricity markets. Markets do not tend to become unbalanced or unwittingly fall into structural shortages. Rather, investment costs are weighed up and minimum requirements for return on investment are set. Only when planning security is increased through long-term contracts with built-in inflation protection clauses is infrastructure investment even considered.

Currently, demand for energy supply from data centers is rising, and industrial consumption is increasing so rapidly that electrification plans and power supply solutions must be made available quickly if we do not want to fall behind in terms of competitiveness. Data centers are just one element in a dramatically changing environment in Europe, and their impact should be assessed in a circular, comprehensive manner, as is increasingly the case with all other factors involved in this development.

Modernizing vulnerable infrastructure remains the order of the day. This applies to power and rail networks, ports, highways, but increasingly also to communication networks extending into space (satellites).

We remain convinced and invested in Zurich Airport (+16%). The management’s forecast of around 32 million passengers for the year as a whole is likely to be clearly exceeded. It remains interesting that the company is increasingly focusing on revenue outside its regulated business, for example, the retail space before and after security checks, real estate such as The Circle and the Radisson Blu Hotel, and foreign investments (e.g., Noida in India). A significant dividend increase is on the horizon, which should lead to a dividend yield of 3.0% – with an upward trend in distributions in the coming years.

Asset sub-class 3–6 months 12–24 months Analysis
Residential properties CH The SWIIT real estate fund index (+9.7%), which is primarily composed of residential investment properties, performed well in 2025. However, the potential for price increases is now low.
Office and retail properties CH With growth of 4% in December alone, our addition Swiss Prime Site has integrated well into the real estate and infrastructure sector.
Real Estate Fund CH The Swiss Real Estate Fund Index (CHREF) is practically at its all-time high. The last 12 months have yielded a return of +8.4%.
Infrastructure Equity / Fund Several infrastructure stocks remain important elements in our DecarbRevo solutions because they pursue a decarbonization strategy.

Equity

Artificial intelligence drives the markets

Artificial intelligence (AI) is still driving the markets. Sam Altman, CEO of AI company OpenAI, has declared a “red alert.” Three years ago, OpenAI triggered the current boom with its Chat GPT. But others have also made progress, and OpenAI is panicking, not only because of Chinese and European competition. Search engine operator Google developed an advanced AI solution complete with high-performance chips, catapulting itself to the top of the competition.

Read more Close
The MSCI World 2025 global equity index in USD and CHF (Source: Bloomberg L.P. | Chart: Zugerberg Finanz)

The search for capital and talent continues, while smaller companies compete with America’s powerful tech monopolies, which are printing money faster than the Fed during the pandemic. Meta (Facebook) is also getting involved. Zuckerberg reportedly plans to cut his spending on the metaverse by 30% and buy cheaper AI chips from Google instead of Nvidia in order to further focus resources on winning the AI race.
The typical Silicon Valley behavior prevails: coopetition – cooperation with the same company in some areas, competition and rivalry in others. No one can even begin to say what it means to win this race. But anyone who has already bet everything on AI knows that defeat is not an option. So the competition is becoming increasingly intense. It is worth considering that nothing like this has ever happened before in history. The world’s most powerful companies may have their headquarters in California, but they are no longer simply exploiting their monopolies. They are leveraging the world’s best intellectual tech talent and an unprecedented amount of capital expenditure in a race into the unknown, with no guard rails, no airbags, and no guarantees.
Competition is also looming from China, where, following early AI developers DeepSeek and Moonshot AI, more than 500 language models are now vying for customers. Beijing has signaled to domestic tech companies such as Tencent, Alibaba, and Bytedance (Tiktok) to replace Nvidia chips with domestic solutions from chip manufacturers such as Huawei, Xiaomi, Moore Threads, and Cambricon. The government itself is pumping around $50 billion into the industry over the next five years to break away from the US. This is fueling speculation in China, which is why Chinese stocks are also skyrocketing: Moore Threads, for example, is valued at just under $40 billion on the stock market, but only achieved sales of just over $100 million last year – and incurred losses of almost the same amount. Whether the company will ever turn a profit is questionable.
Unless you are a top technology expert, you are currently bombarded with numerous news items that are difficult to classify. About two weeks ago, for example, Nvidia reported benchmark data that was ten times faster than the models from the Chinese laboratories DeepSeek and Moonshot AI. Nvidia has an extreme co-design between chips, networks, and software. The crucial question is whether these figures offer users freedom or merely represent a more lucrative form of lock-in. At the same time, we must abandon the idea of incremental progress. What we are currently experiencing is a technological acceleration unlike anything humanity has ever seen before. This will result in productivity potential in the coming decade that we cannot even begin to imagine.

Asset sub-class 3–6 months 12–24 months Analysis
Equity Switzerland The Swiss stock market ended 2025 up 14.1%, with a very wide spread between Holcim (+75%) and Sika (-25%).
Equity Eurozone, Europe In the Stoxx Europe 600 (+16.1% in CHF), banks (+67%), utilities (+28%) and insurance companies (+25%) were the winners, while automotive, chemicals and media were the losers.
Equity USA Numerous equities such as Apple (-5% in CHF), Amazon and Netflix (both -8%), Berkshire (-3%) and Microsoft (0%) underperformed Alphabet (+44%) and Nvidia (+21%).
Equity Emerging markets In China, AI stock prices in particular shot up speculatively, profits declined, and the domestic market struggled with deflationary trends.

Alternative investments

A new course is being set

The challenge for a portfolio is to take advantage of suitable diversification opportunities. If all securities in a portfolio are moving in the same direction, there is no diversification. Most of the price increases in the MSCI World in 2025 were achieved with stocks that are related to AI in some way. The threat was that in many cases, the higher prices had nothing to do with higher profits. That is why there could be another decline. Alternatives are in demand.

Read more Close

Traditional portfolio theory focused solely on combining stocks and bonds. Real estate was already considered an alternative. The past decades have also proven its value in diversifying real assets. Over the past two decades, infrastructure has emerged as an asset class with valuable characteristics that also contribute to diversification.

Commodities as an alternative investment cover a range of sub-themes: oil and gas, industrial and precious metals, foodstuffs, and cryptocurrencies. We recognized such an opportunity in Bitcoin, but in 2025 it took a disappointing turn (-18% in CHF). Since 2008, Bitcoin’s price trend has followed a pattern: two years up, two years down. Technically, there are currently no signs of a reversal of this pattern for the so-called “digital gold.” Since its peak on October 6, the decline has been particularly sharp (-30%). Precious metals, on the other hand, have seen a new revival (gold +50% in CHF), and gold purchases by central banks in emerging markets such as Poland, Kazakhstan, Brazil, and China continue.

Crude oil prices have fallen by 22% in dollars (-31% in Swiss francs). The US intervention in Venezuela has done nothing to change this. On the contrary, Donald Trump wants the energy rights back. At the heart of the dispute was Venezuela’s Orinoco oil belt, one of the world’s two richest areas for heavy and extra-heavy oil. It is also a region where US oil giants such as ExxonMobil, Chevron, and ConocoPhillips have long been active. Their refineries in Texas are geared towards heavy oil and are now set to return to full capacity. In 2007, Hugo Chavez ordered the transfer of a majority stake in all projects in the Orinoco to the Venezuelan state-owned company PDVSA. In addition, Venezuela is rich in a range of minerals, including rare earths, which are crucial for modern technologies. The US wants to secure strategic access to these.

However, we are not seeking diversification primarily in commodities, but in private market investments. 2026 is likely to be a good year for long-term private market investments, thereby achieving the hoped-for diversification effect in the overall portfolio. Lower interest rates are accompanied by better valuations. Transaction volume developed positively in the fourth quarter of 2025 and started the new year on a confident note. This is likely to lead to significant additional income for private market managers such as KKR, Blackrock, Apollo, EQT, Partners Group, and HBM Healthcare Investments.

Private market investments are also particularly interesting because they play a growing role in the financing of equity (private equity) and debt (private credit) in the areas of infrastructure, energy, data centers, and AI. Many companies appreciate being able to drive their growth away from stock market-related quarterly reporting on customers, margins, profits, etc.

While it went public in 2004, just eight years after its founding, the length of time spent outside the stock market has doubled over the past 20 years. In addition, technology leaders such as AI pioneer OpenAI and space-related SpaceX can also conduct attractive financing rounds, even though their valuations have long since significantly exceeded those of Roche or Nestlé.

Asset sub-class 3–6 months 12–24 months Analysis
Commodities The Orinoco mining belt contains the world's largest gold reserves. If these reserves, worth CHF 880 billion, were to be extracted, it would change the gold market.
Gold, precious metals Silver continued to rise at the start of January. At the beginning of 2025, an ounce still cost around $30, but now it is over $80.
Insurance Linked Securities Insurance-related bond risks are genuine diversifiers and are used in our long-term vested benefits solutions.
Private equity In 2026, transactions in the corporate M&A business are likely to accelerate further, leading to good results for private market managers.

Summary

Asset class 3–6 months 12–24 months Analysis
Macroeconomics The AI boom in the US is losing momentum. In contrast, Europe is generating growth momentum again. Poland remains the growth leader, ahead of Ireland and Spain.
Liquidity, currencies The rising cost of living in the US is diametrically opposed to the White House's demands for a significant easing of monetary policy.
Bonds With the two Zugerberg bond solutions (+1.4% and +3.4%), we significantly outperformed the Swiss Bond Index (-0.1%) in 2025.
Real estate, infrastructure The shortage in the broad housing market continues. In terms of rents, the top segment is under pressure. Across the board, asking rents are also declining in some cases.
Equities Strong profits cannot dispel growing doubts about the profitability of AI investments, some of which are unexpectedly high.
Alternative investments Concerns about systemic problems in the private credit segment remain clearly exaggerated. There is definitely strong potential for recovery here.

Market data

Asset class Price (in local currency) Monthly / YTD / Annual performance (in CHF)
Equity 31.12.2025 12/2025 2025 2024 2023 2022
SMI CHF 13'267.5 +3.4% +14.4% +4.2% +3.8% –16.7%
SPI CHF 18'219.5 +3.2% +17.8% +6.2% +6.1% –16.5%
DAX EUR 24'490.4 +2.6% +21.6% +20.4% +13.1% –16.3%
CAC 40 EUR 8'149.5 +0.3% +9.4% –1.0% +9.6% –13.9%
FTSE MIB EUR 44'944.5 +3.5% +30.0% +14.1% +20.4% –17.3%
FTSE 100 GBP 9'931.4 +2.6% +14.1% +12.1% –0.3% –8.8%
EuroStoxx50 EUR 5'791.4 +2.1% +17.3% +9.6% +12.1% –16.0%
Dow Jones USD 48'063.3 –0.5% –1.3% +22.1% +3.5% –7.7%
S&P 500 USD 6'845.5 –1.2% +1.7% +33.4% +13.1% –18.5%
Nasdaq Composite USD 23'242.0 –1.7% +5.2% +39.2% +30.6% –32.3%
Nikkei 225 JPY 50'339.5 –1.4% +10.9% +15.2% +8.6% –19.7%
Sensex INR 85'220.6 –2.4% –9.3% +13.8% +7.4% –4.8%
MSCI World USD 4'430.4 –0.5% +4.4% +26.6% +10.8% –18.5%
MSCI EM USD 1'404.4 +1.5% +14.1% +13.6% –2.6% –21.5%
Bonds (mixed) 31.12.2025 12/2025 2025 2024 2023 2022
Glob Dev Sov (Hedged CHF) CHF 151.7 –0.8% –1.0% –1.4% +2.2% –13.2%
Glob IG Corp (Hedged CHF) CHF 187.5 –0.5% +2.5% –0.8% +4.2% –16.7%
Glob HY Corp (Hedged CHF) CHF 379.5 +0.4% +5.4% +6.1% +8.7% –13.6%
USD EM Corp (Hedged CHF) CHF 287.8 0.0% +5.9% +2.4% +4.5% –18.2%
Government bonds 31.12.2025 12/2025 2025 2024 2023 2022
SBI Dom Gov CHF 186.4 –1.5% –0.2% +4.0% +12.5% –17.0%
US Treasury (Hedged CHF) CHF 138.6 –0.7% +1.7% –3.8% –0.5% –15.0%
Eurozone Sov (Hedged CHF) CHF 176.9 –0.9% –1.8% –0.8% +4.8% –18.9%
Corporate bonds 31.12.2025 12/2025 2025 2024 2023 2022
CHF IG Corp (AAA-BBB) CHF 192.3 –0.5% +0.7% +5.1% +5.7% –7.5%
USD IG Corp (Hedged CHF) CHF 189.9 –0.6% +3.1% –2.4% +3.5% –18.5%
USD HY Corp (Hedged CHF) CHF 632.2 +0.1% +4.0% +3.7% +8.5% –13.7%
EUR IG Corp (Hedged CHF) CHF 169.0 –0.4% +0.7% +2.0% +5.9% –14.1%
EUR HY Corp (Hedged CHF) CHF 311.2 +0.1% +2.8% +5.4% +9.8% –10.9%
Alternative investments 31.12.2025 12/2025 2025 2023 2022 2021
Gold Spot CHF/kg CHF 110'066.6 +0.5% +43.8% +36.0% +0.8% +1.0%
Commodity Index USD 109.7 –1.8% –2.9% +8.3% –20.4% +15.1%
SXI SwissRealEstateFunds TR CHF 2'983.0 +0.7% +9.9% +16.0% +5.4% –17.3%
Currencies 31.12.2025 12/2025 2025 2024 2023 2022
US dollar / Swiss franc CHF 0.7917 –1.5% –12.8% +7.8% –9.0% +1.3%
Euro / Swiss franc CHF 0.9306 –0.2% –1.0% +1.2% –6.1% –4.6%
100 Japanese yen / Swiss franc CHF 0.5062 –1.6% –12.1% –3.4% –15.4% –11.0%
British pound / Swiss franc CHF 1.0665 +0.3% –6.1% +6.0% –4.2% –9.3%
Back to News