Monthly Report 09/2023

Lake Aegeri in the canton of Zug (Photo: Andreas Busslinger)
Publications

Autumnal mood

The economic development in autumn 2023 matches the weather in this colorful season. The sun is no longer as high in the sky, the days are getting a little cooler and shorter. Likewise, some national economies are showing strong economic colors with cooling momentum, making the autumn forest shine like gold in monetary policy terms. The hot spell in the North American and European labor markets is over. On the contrary, recent labor market data paints a picture of reasonable wage developments, which, alongside corresponding productivity improvements, are already in line with long-term inflation targets and are maintaining the purchasing power of private households at the same time, thanks to a declining inflation trend.

As expected, consumption is likely to emerge as the dominant economic pillar in the second half of the year. A harsh winter is not on the horizon. Those companies that have positioned themselves well strategically and have done their homework when it comes to operational matters are now benefitting from solid balance sheets despite the interest rate hikes and are enjoying autumn in all its colorful splendor.

The enemy of real values such as equity and real estate is interest rates. The prospects here have improved, because the key interest rate hike cycle is expected to be essentially complete in September. In addition, some bonds have become more attractive than they have been in 15 years due to changes in interest rates.

Slight losses in August

The capital markets were afflicted by key interest rate increases and corresponding expectations of further increases in August. It was only towards the end of the month that we saw more clement economic data, which – at least in the leading monetary policy market, the USA – points to the end of the hike cycle. But rising interest rates hurt equity, bonds, and real estate. The Swiss equity market (-1.6% in August) was still one of the best indices in the world. The German DAX (-3.0%), the British FTSE 100 (-2.6%), the American S&P 500 (-1.6%), and the emerging market index (-6.1%) had poorer performance. The downward trend also affected the Swiss real estate index SWIIT (-2.6%) and the US Treasury bonds (-1.6%).

Portfolios with a higher equity share consequently suffered greater losses in value than those with a lower equity share. Portfolios with a high bond share underwent only a slight correction in August. In risk class 1 with a maximum 20% equity share (e. g., Revo1 -0.5%, vested benefits FZ R1 -0.1%), the fluctuations were significantly lower than, for example, in risk class 3 (e. g., Revo3 -1.4%, vested benefits FZ R3 -0.6%). The strategies with higher equity shares and the dividend-focused mandates suffered losses of around -2% in August, but are still in the lead when looking at the year as a whole.

Turning to the exchange rates, August saw a slightly stronger dollar. Most recently, it traded at 0.88 against the Swiss franc on 31 August (+1.3% in one month, -4.4% since the beginning of the year). The euro remained stable against the Swiss franc in August.

Strategies mainly based on individual titles Strategy performance*
August 2023 YTD 2023
Zugerberg Finanz R1 –0.6% +3.0%
Zugerberg Finanz R2 –1.1% +5.3%
Zugerberg Finanz R3 –1.3% +6.5%
Zugerberg Finanz R4 –1.4% +8.0%
Zugerberg Finanz R5 –1.2% +6.7%
Zugerberg Finanz RDividends –1.8% +9.0%
Zugerberg Finanz Revo1 –0.5% +3.7%
Zugerberg Finanz Revo2 –1.0% +6.3%
Zugerberg Finanz Revo3 –1.4% +7.4%
Zugerberg Finanz Revo4 –1.4% +8.6%
Zugerberg Finanz Revo5 –1.7% +9.8%
Zugerberg Finanz RevoDividends –2.3% +10.2%
Zugerberg Finanz DecarbRevo3 –3.4% –2.8%
Zugerberg Finanz DecarbRevo4 –4.9% –4.7%
Zugerberg Finanz DecarbRevo5 –6.3% –6.2%
Zugerberg Finanz Vested benefits Strategy performance*
August 2023 YTD 2023
Zugerberg Finanz Vested benefits R0.5 +0.2% +1.6%
Zugerberg Finanz Vested benefits R1 –0.1% +2.8%
Zugerberg Finanz Vested benefits R2 –0.2% +4.4%
Zugerberg Finanz Vested benefits R3 –0.6% +5.0%
Zugerberg Finanz Vested benefits R4 –1.3% +5.6%
Zugerberg Finanz 3a pension solution Strategy performance*
August 2023 YTD 2023
Zugerberg Finanz 3a Revo1 –0.5% +3.7%
Zugerberg Finanz 3a Revo2 –1.0% +6.3%
Zugerberg Finanz 3a Revo3 –1.4% +7.4%
Zugerberg Finanz 3a Revo4 –1.4% +8.6%
Zugerberg Finanz 3a Revo5 –1.7% +9.8%
Zugerberg Finanz 3a RevoDividends –2.3% +10.2%
Zugerberg Finanz 3a DecarbRevo3 –3.4% –2.8%
Zugerberg Finanz 3a DecarbRevo4 –4.9% –4.7%
Zugerberg Finanz 3a DecarbRevo5 –6.3% –6.2%
* The stated performance is net, after deduction of all running costs, excluding contract conclusion costs

Macroeconomics

European economies under pressure

With its population of 500 million, economic development in Europe cannot keep up with the structural dynamism of the growing Asian economies, home to a population of around 5 billion. But present-day Europe, more homogeneous due to crises such as Covid and the war in Ukraine, works better under pressure anyway. The European Union, rather than individual countries, is setting the ground-breaking course for the future.

Read more Close
Share of the industrial sector in the gross domestic product in 2021 in % (Source: World Bank | Graphic: Zugerberg Finanz)

Europe is currently unable to keep up with real growth in either Asia or America. But it has taken significant steps to bring value creation back to the old continent in a global economy with a trend towards regionalization. Europe is benefiting from industrial reshoring after the post-pandemic supply chain problems. This includes the large program of innovation financing through the European Investment Fund, the establishment of a competitive semiconductor industry, the focus on renewable energies, and further harmonization to break down border-specific trade barriers within Europe.

This national economic perspective can and must be broken down to industry-specific development. This is also where European competitiveness, which has suffered in industrial terms, becomes apparent. The most competitive markets serve as a warning signal. While the USA has often been the largest homogeneous market so far, it has now been replaced by China in many cases. This is where the world’s largest car market is located, for example. It is now Chinese companies that dominate the market, which is strongly shaped by battery-powered electric cars and plug-in hybrids. The German VW Group, long a leader in China, has now even been overtaken by Tesla. But it is the Chinese BYD Group that is dominant; its founder, Wang Chuanfu, actually modeled the corporation on the German BMW Group 30 years ago. Today, German brands play only a minor role for Chinese buyers.

BYD is an acronym of the Group’s slogan “Build Your Dreams”. North of Hong Kong, in Shenzhen, where most Chinese tech companies are also based, in less than three decades BYD grew to a group with 630,000 employees which, in addition to car production, is also one of the leaders in battery production and has even become the supplier for Apple’s iPads.

Bad headlines have been coming out of China recently: rising youth unemployment, struggling real estate companies, and over-indebted local governments. Consumers are holding back. Nevertheless, the economy is expected to grow by more than 4% this year. European exporters, on the other hand, are showing weaknesses: they need to diversify better so that they do not, for example, miss out on India’s structural rise.

The euro is an important currency, but let’s be realistic: it is the central currency for Europe, and has been just as (un)stable as the dollar over the past two decades. However, the euro will never take on the same significance as the dollar. The dollar remains the anchor currency of the global economy, even if emerging markets have ideas about driving forward a “de-dollarization”.

Region 3–6 months 12–24 months Analysis
Switzerland Switzerland's economic growth is currently cooling somewhat, with the service sector likely to make an above-average contribution to growth.
Eurozone, Europe The latest ECB assessments do not point to a recession, but a period of stagflation lasting two quarters has become more likely.
USA For the first time since the Fed started raising interest rates 18 months ago, the labor market is showing signs of moderation. This means that the cyclical interest rate peak has been reached.
Rest of the world Emerging markets are in a comfortable position. This will also become evident at the upcoming G-20 summit with their unbroken momentum.

Liquidity, currency

Inflation still on the decline

There is no doubt that inflation will continue to decline in autumn 2023. But the steep part of the decline is already behind us. A year ago, inflation in the USA was 9%, now it is 3%. However, if housing costs were calculated and weighted the same way they are in Europe, US inflation would already be below the target of 2%. In Switzerland, only the Swiss National Bank (SNB) can fuel inflation over the next 12 months.

Read more Close
Shelter inflation differs widely across economies according to its share of the CPI basket (Source: GoldmanSachs | Graphic: Zugerberg Finanz)

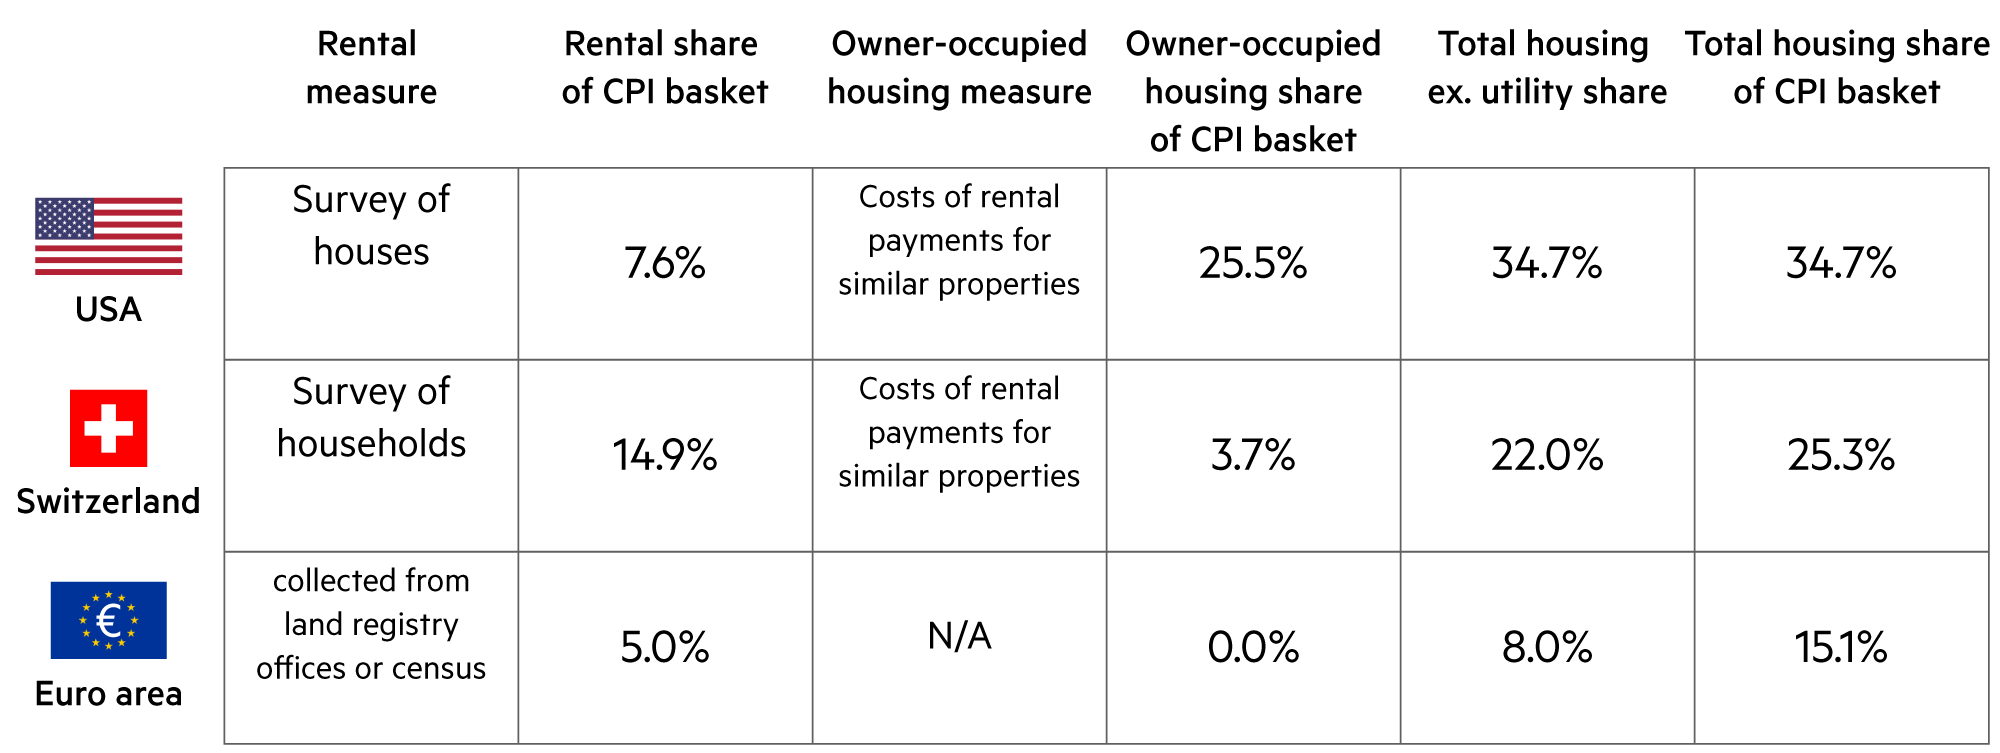
The SNB greatly underestimated the upswing in inflation in 2022. In January 2023, inflation was +3.3% compared to the same month of the previous year. But the impressive decline was likewise unexpected. The inflation rate has more than halved within a very short time. In August 2023, inflation in Switzerland was +1.6% compared to the same month of the previous year. Core inflation even fell to +1.5%. This is evident from the latest figures from the Federal Statistical Office (FSO).

We have always been somewhat more optimistic than the SNB when it comes to inflation trends. This is mainly due to the fact that we have assessed the development of rental prices differently. The FSO incorporates the results of its rent index into the inflation rate on a quarterly basis in the months of February, May, August, and November. As a result, the effects of the SNB’s key interest rate increases, which have a large influence on the reference rate for rents, are factored into the index at a delay. We expect the next boost from November 2023 onwards, which could be even larger if the SNB tightens the reins again when it reviews its monetary policy on 21 September.

Due to the increased reference mortgage rate for leases in June 2023, moderate rent increases are expected. The extent to which and how quickly the adjustments to existing leases will affect the results of the rental price index can be assessed in the quarters from November 2023 onwards. These effects are not yet visible in August 2023. In addition to the adjustments due to the increased reference interest rate (1.5%), which could even be accelerated by the SNB decision in September, a large number of other factors also influence the rental price development captured in the rental price index (such as new constructions, renovations, or tenant changeover).

The interesting thing is that although we compare inflation values across borders, we overlook the fact that the corresponding variables are measured very differently. When looking at US inflation as a trendsetter, it is important to know that “housing” is factored into the inflation calculation with a weighting of around 35% and that this factor is technically linked to the Fed’s key interest rate. If the Fed stops raising key interest rates for a year, inflation will stay out of this range. If housing costs were calculated and weighted the same way today as they are in the eurozone, inflation would already be below the Fed’s target – which would be accompanied by faster key interest rate cuts, more stable real estate markets, more robust regional banks, more stable economic prospects, and rising equity prices.

Asset class 3–6 months 12–24 months Analysis
Bank account A lot of consideration should be given to deciding whether to invest in a savings account, medium-term bonds that do not conserve purchasing power, or sound securities investments.
Euro / Swiss franc The euro remained stable at 0.96 in August. Technically, however, the outlook for the euro has deteriorated.
US dollar / Swiss franc The devaluation pressure continues unabated due to the huge twin deficits (government budget balance, trade balance) and higher inflation.
Euro / US dollar In August (-1.4%), the euro lost almost its entire lead from 2023 and ended the month only 0.9% above the beginning of the year.

Bonds

Achieving an attractive return with bonds

Individual segments in the bond market are large and liquid, others are small, somewhat illiquid, and yet – or precisely for this reason – attractive. In any case, we combine different segments in our bond solutions. The market also offers various potential sources of returns. We consider diversification as well as scrupulous selection to be very important.

Read more Close
The MOVE Index of US bond market volatility over the past 12 months (Source: ICE Bank of America MOVE Index | Graphic: Zugerberg Finanz)

In the bond markets, volatility has dropped back down now that the cycle of key interest rate hikes is nearly over. In Switzerland, inflation is at 1.6% and core inflation (1.5%) remains on the decline. The only institution that could directly fuel inflation is the Swiss National Bank (SNB) – provided that it raises the key interest rate by a further 25 basis points to 2.0% on 21 September. However, this is by no means necessary, and therefore the probability of such an increase is currently only 28%.

In the USA, the peak of the cycle has been reached. The implicit market expectations no longer assume there will be further interest rate hikes. Instead, a total of around five interest rate cuts of 0.25% each are expected by January 2025 and eight cuts by the end of 2025. The Fed’s Open Market Committee itself has determined that the key interest rate will settle at between 3% and 3.5% in the longer term. Consequently, this will result in a reduction margin of 2.0% in the coming eight quarters.

Accordingly, US Treasury bonds are attractive, as the largest bond segment in the world at just under $32,000 billion. The longer-term bonds are popular in particular, because they offer potential price gains in addition to interest payments. This also applies to longer term corporate bonds with a high credit rating. However, there are not so many of them in the $11,000 billion high-grade corporate bond market. Top-rated companies such as Microsoft (AAA) are rare, but yield a higher return than US Treasuries with a slightly lower AA+ rating.

Because European countries are much less indebted than the USA, the market for government bonds is “only” around €12’000 billion. At €2’400 billion, the market for the approximately 3’500 high grade corporate bonds also comprises only a fraction of the equivalent dollar market. This volume does not even correspond to Apple’s market capitalization and also explains the relatively low liquidity of individual bonds compared to the trade for an Apple share.

This is even more true in the even smaller areas of high-yield bonds in dollars and euros. These are comparatively niche markets with extremely attractive semi-liquid bonds from numerous companies that are household names (e. g., Elektrolux, Marks & Spencer, Hurtigruten). In this segment, interest rate risks play a subordinate role. What matters are the credit risks, which require selective and scrupulous diversification. For example, with Scandinavian corporate bonds, which have variable interest rates more often average, which was an advantage in the phase of interest rate increases.

Asset sub-class 3–6 months 12–24 months Analysis
Government bonds The inverted yield curve persists in Switzerland. The Swiss federal bonds yield 1.03% (2 years) in the short term and 0.90% (10 years) and 0.85% (30 years) in the long term.
Corporate bonds Ultimately, it's always the credit quality that counts, not the rating. This is another reason why many companies forgo the expensive rating reports and processes.
High-yield, hybrid bonds Structurally, the attractive market niche for hybrid bonds has remained under sustained pressure since March 2023. This requires a lot of patience from investors.

Zugerberg Finanz bond solutions

Interesting bond yield mark-ups

With around 40 transactions in the Zugerberg Income Fund (ZIF) and 30 transactions in the Credit Opportunities Fund (COF) in August alone, changes have been made in both funds that should pay off in the coming years. We will also use the wide-open issuance window in September to acquire attractive bonds.

Read more Close
Price performance of the Luzerner Kantonalbank 1.5% Junior Subordinated Perpetual (Source: Bloomberg Finance, 01/2021–08/2023 | Graphic: Zugerberg Finanz)

The ZIF and COF differ even more than before, and the overlaps are minimal. We believe that corporate bonds with a high credit rating and a long duration are particularly attractive in dollars. After all, US corporate bond yields have risen to a 16-year high. Recently, data from a weakening economy reinforced the expectation that the period of rising interest rates and yields (and thus falling prices) was over. The real return (nominal redemption yield minus the expected inflation rate) is higher than it has been in decades.

That is why, for example, a bond from Microsoft was included in the ZIF, which will yield 4.8% p.a. over the next 27 years. This is attractive, plain and simple, even after the cost of currency hedging. Similar transactions in the best debtor categories were made in the ZIF with Deutsche Bahn (with Germany as the guarantor) and companies with strong cash flows, such as Nvidia, Starbucks, McDonald’s, and the Zürcher Kantonalbank. In general, the remaining terms are now higher and the credit ratings better.

The COF focuses on credit risk premiums. The typical residual maturity of a bond in the COF is three to four years. However, the interest rate risks are much lower because the portfolio contains a number of corporate bonds whose coupons adjust to the money market interest rate on a quarterly basis. These are known as “floaters”. In addition, a number of very good debtors are represented in the COF, but each with subordinated bonds. These usually still have a high-grade rating. Bonds from UBS, Swiss Re, Zurich Insurance, Allianz, Julius Baer, Volkswagen, and Telefonica, for example, are among the positions that we consider to be an opportunity and were therefore newly added or increased in August.

There is a special complexity premium for investors in subordinated bonds issued by financial institutions. These markets are inefficient and barely react to fundamental changes. As can be seen from the graph using the example of a subordinated bond from the Luzerner Kantonalbank, which has a BBB rating, increases in the interest rate led to declining prices. On top of this came the shock of how subordinated bonds were handled in the collapse of Credit Suisse in March 2023. The bond has not recovered from this to date, although the Luzerner Kantonalbank carried out a capital increase of around CHF 500 million in the first half of 2023, substantially strengthening its own equity situation.

Zugerberg Income Fund Credit Opportunities Fund
Yield in 2023 (since the beginning of the year) +2.5% +0.6%
Yield since the start (annualized) -11.5% (-2.3%) +20.6% (+1.7%)
Proportion of months with positive yield 53% 66%
Credit risk premium in basis points (vs. previous month) 236 BP (-8 BP) 654 BP (-57 BP)
Average rating (current) BBB+ BB

Real estate, infrastructure

The importance of real estate and infrastructure

Real estate and infrastructure facilities are of central importance for a prosperous economy. Currently, cash flows in both areas are improving, yet valuations are still declining. This is currently felt in particular by the real estate investment property segment, where a significantly increased discount rate is weighing on present-value valuations.

Read more Close
Transport infrastructure is central to a prosperous economy (Photo: Maurice Pedergnana)

A prosperous economy is a growing economy, so the need for space likewise increases. The main drivers of housing demand, for example, are household income and demographics, with immigration to Switzerland standing out in particular. In Switzerland as a whole, there is currently a shortfall of around 10,000 additional apartments needed to ensure steady real rents. More complex building permit procedures, endless appeals, and legal hurdles slow down the rapid implementation of construction projects, especially in large cities. “The delays are increasing,” researchers Marco Salvi and Patrick Schnell recently noted.

However, in the last two years, construction investment has also declined by 10% in real terms due to the unfavorable confluence of various factors. In many places, a significant economic slowdown was predicted. In addition, the construction price index shot up significantly post-pandemic. According to the Federal Statistical Office, anyone building a single-family or multi-family house in the Greater Zurich area would have to contend with 14.8% and 15.2% higher costs respectively in the spring of 2023 than in October 2020. The increase was even higher in northeastern Switzerland and slightly lower in the Central Plateau.

But even if construction prices stop rising so rapidly, there is now another challenge facing real estate investors. The borrowing costs in October 2020 were around 1% and are now 2.5% annually, which means that anyone carrying out construction today will have to contend with much higher financing costs.

While new rents have risen in recent years, the adjustment of existing rents is tied to inflation and interest rates, which has led to a difference between new and existing rents. The existing rents are often cheap, especially in big cities. This particularly affects “mobile” households, i.e., those where a disproportionate number of new tenants are young, divorced, and / or immigrants. Although ageing increases the pool of inexpensive apartments by 13’400 apartments per year by making apartments cheaper over the course of their life cycle, this is not enough to meet the demand by far.

There is not enough construction being done. This is also due to restrictive mortgage lending. The affordability requirements were significantly tightened due to macro- and micro-prudential market supervision around ten years ago and have led to a declining ownership ratio in Switzerland.

The strain on infrastructure is more equitable. There is no systematic disadvantage in this area. In Switzerland, the public infrastructure (air traffic and railway infrastructure, schools, multi-story car parks, roads, and local transport companies, etc.) enjoys an excellent reputation – not least thanks to the Federal Office of Transport, which plans 20 to 30 years in advance (the “Perspektive Bahn 2050” strategy).

Asset sub-class 3–6 months 12–24 months Analysis
Residential properties CH SARON mortgages have become cheaper. In October 2022, the interest rate was still 2.8%. It has now fallen below 2.5% on average.
Office and retail properties CH In Switzerland, the application of increased discount rates (3.9%) leads to a lower valuation of commercial real estate portfolios.
Real Estate Fund CH The development (SWIIT -2.8% since the beginning of the year) shows that the downwards valuation adjustments are still not over.
Infrastructure Equity / Fund The strong infrastructure performance also continued in August. Total returns, e. g., from Zurich Airport (+30%) and BKW (+23%), are significantly outperforming the SMI.

Equity

Careful selection stands the test

Overall, August was a difficult month for equity investors. But our careful selection process has stood the test, especially when it comes to the key foreign securities chosen to complement and enhance the portfolios, which predominantly contain Swiss securities.

Read more Close

The half-yearly reports and investor conferences have often confirmed the trend that our scrupulously selected securities are currently in sound shape and have at times been able to achieve strong total returns over the course of the year to date. In addition, the most important technology support lines have taken effect in the critical mood phases in recent weeks. Thanks to these international market leaders, our portfolios have shown robust development so far this year:

Google (+55%): The Group is generating a free cash flow that is more than twice that of Amazon or Meta (Facebook) and has outstanding prospects.

Apple (+45%): With $167 billion in cash, the world’s most valuable company is well supplied with liquid assets and has a great deal of room for maneuver to acquire attractive young companies and integrate them into its own community. Apple also generates approximately $124 billion in gross profit from its operating business annually, which equates to more than $300 million per day. Apple has distributed $788 billion to shareholders through share buyback programs over the past decade. Apple’s market capitalization is twice that of the SMI as a whole.

Microsoft (+38%): Behind Apple and ahead of Google, Microsoft’s EBITDA generation is around $100 billion annually and it currently has an annual turnover of $212 billion. It is in a kind of competition for the title of the GOAT (“greatest of all time”) alongside Google and Apple. In any case, these three companies have an AAA rating, i.e., their creditworthiness is rated higher than that of the USA.

KKR (+37%): The top specialist in alternative investments benefits from the fact that economic conditions worldwide are brightening and a global recession has become a more remote possibility.

Various European titles were also able to achieve impressive performances.

Saint Gobain (+37%): Sika’s competitor is exhibiting excellent development (+14%), in particular thanks to its specialization in the renovation business and industrial lightweight construction. The title will be included in the Euro Stoxx 50 Index on 18 September – a valuable distinction for a modestly valued company.

SAP (+36%): There are different positioning options in the IT industry: hardware or software, IT services, semiconductors, or the equipment business. SAP has occupied a lucrative market segment focusing on enterprise management software and remains the undisputed world market leader. In the short term, the valuation seems fair to us; we consider it attractive in the longer term and for patient investors. SAP is one of the market leaders in the field of artificial intelligence. The new global head of SAP set up the corresponding division at Microsoft and ran it for a long time.

DHL Group (+28%): Kühne+Nagel’s German competitor is showing impressive development (+30%) and has increased its guidance for the year 2023 overall. The valuation is still significantly cheaper than that of K+N and the dividend yield is well above 4% with interesting prospects.

Axa (+13%): The world’s largest insurer has so far clearly outperformed its competitor Zurich Insurance (-1%) with its total return. The result in the first half of the year (+€4.1 billion) clearly showed it is on track to achieve the guidance for the current year (+€7.5 billion). The high solvency ratio (+20% to 235%) also raises hopes of profit consolidation through a share buyback program under the new IFRS 17 accounting guidelines.

The global laboratory equipment supplier ThermoFisherScientific (+1%), which performed better than Roche Diagnostika (Roche -7%), has experienced a slump in the share price so far this year. By contrast, the Indian basket of shares (+8%) performed well above average, rising significantly faster than its benchmark MSCI Emerging Markets (+5%). Its prospects remain intact, as the Indian subcontinent is experiencing excellent structural momentum.

Asset sub-class 3–6 months 12–24 months Analysis
Equity Switzerland The SMI lost 1.6% in August. UBS was an upwards outlier (+22%). At the lower end of the scale were Richemont (-10%), Geberit, and Sika (both -7%).
Equity Eurozone, Europe UBS achieved the best performance in Europe in August. The price of the payment provider Adyen halved (-90%).
Equity USA A good performance is expected, especially in the final quarter. This has been a well-established seasonal pattern for over a hundred years.
Equity Emerging markets The broad MSCI Emerging Markets index has been strongly influenced by Chinese equities so far this year and its performance has been unconvincing so far.

Alternative investments

Crude oil prices on the rise

As a sign of a recovering global economy, we have seen crude oil prices approach $80 per barrel again over the past two months. The outlook for private market investments has also improved since the window for newly listed companies has reopened. In addition, subordinated bonds from insurance companies are becoming established as an interesting, highly profitable niche.

Read more Close
WTI crude oil prices in US dollars over the past 24 months (Source: Bloomberg Finance | Graphic: Zugerberg Finanz)

Alternative investments are a field of investment opportunities that do not fit into the traditional vessels (equity, bonds, and real estate). These investments are not homogeneous and do not have uniform risk/return patterns.

One category is commodities. Strong global economic growth tends to contribute to increased commodity prices. But the steepness of the supply and demand curves varies greatly in the different individual markets, which in some places enables a cartel-like situation (e. g., in the crude oil segment due to supply shortages). Crude oil prices have risen by almost 4% this year as a result of corresponding cutbacks. In other markets, there is much more speculation (e. g., in the case of liquefied gas). Numerous speculators bought gas to sell it at higher prices in a cold winter or spring. That plan backfired. Gas prices are now 35% to 60% lower than at the beginning of the year.

A second category is subordinated insurance bonds. The insurance industry is well capitalized. On average, the solvency ratio is 217% – with only 100% required to survive a 1-in-200-year loss event. New capital is generated every year, thus increasing the company’s financial flexibility. Axa, for example, had increased its solvency ratio from 217% to 241% through its operations in 2022, which subsequently led to a generous dividend distribution. Even if a stress event were to occur, an insurance company would quickly be able to use tried-and-tested bundles of measures (e. g., more selective underwriting, closure of unprofitable business units, etc.) as part of the annual renewal of insurance companies.

Insurers are not banks and operate according to a more conservative business model. There is no empirical evidence for an “insurance run”. Intensive regulatory oversight prevents strategic adventures. This makes the industry and structural premiums, which can be earned over several years, all the more attractive to us.

Asset sub-class 3–6 months 12–24 months Analysis
Commodities The Bloomberg Commodity TR Index (in dollars) is 3% lower than at the beginning of the year, but has recovered significantly from its low at the end of May.
Gold, precious metals The gold price remained unchanged at the end of August (CHF 1,714) compared to the previous month and was slightly up on the beginning of the year (+1.5%).
Insurance Linked Securities Subordinated insurance bonds have historically low annualized default rates (ca. 0.3%) and therefore continue to have good prospects.
Private equity We expect a noticeable recovery of the "Listed Private Equity" solutions, which are currently traded at discount, over the next 12 months.

Summary

Asset class 3–6 months 12–24 months Analysis
Macroeconomics The business climate in the eurozone improved slightly in August for the first time since the beginning of the year. However, German industry lost its leading position.
Liquidity, currencies The Fed can afford to proceed with patience and wait until the effects of its restrictive policies become apparent (weakening the dollar).
Bonds With 5.3% redemption yields on all US high-grade corporate bonds, the return on capital has risen to the highest level in 15 years.
Real estate, infrastructure There is a large gap between demand in the housing market and the capital market, where the expected returns are increased by key interest rates.
Equities Equities in the USA are expensive compared to bond yields as an alternative. However, this does not apply to equity in Europe or Switzerland.
Alternative investments The outlook for private market investments has improved significantly again after an IPO slump. IPOs are becoming attractive exit strategies.

Market data

Asset class Price (in local currency) Annual performance (in CHF)
Equity 31.08.2023 08/2023 2023 YTD 2022 2021 2020
SMI CHF 11'126.0 –1.6% +3.7% –16.7% +20.3% +0.8%
SPI CHF 14'664.7 –1.8% +6.8% –16.5% +23.4% +3.8%
DAX EUR 15'947.1 –3.0% +11.0% –16.3% +10.4% +3.5%
CAC 40 EUR 7'316.7 –2.4% +9.5% –13.9% +23.6% –7.4%
FTSE MIB EUR 28'831.5 –2.8% +17.9% –17.3% +17.3% –5.4%
FTSE 100 GBP 7'439.1 –3.4% +0.1% –8.8% +16.7% –19.2%
EuroStoxx50 EUR 4'297.1 –3.9% +9.8% –16.0% +16.0% –5.4%
Dow Jones USD 34'721.9 –0.9% +0.3% –7.7% +22.2% –1.8%
S&P 500 USD 4'507.7 –0.3% +12.4% –18.5% +30.6% +6.5%
Nasdaq Composite USD 14'035.0 –0.7% +28.4% –32.3% +25.0% +31.6%
Nikkei 225 JPY 32'619.3 –2.5% +7.8% –19.7% –2.6% +11.6%
Sensex INR 64'831.4 –1.6% +2.1% –4.8% +23.2% +3.4%
MSCI World USD 2'986.0 –1.1% +9.9% –18.5% +23.7% +4.5%
MSCI EM USD 980.3 –4.9% –1.8% –21.5% –1.8% +6.1%
Bonds (mixed) 31.08.2023 08/2023 2023 YTD 2022 2021 2020
Glob Dev Sov (Hedged CHF) CHF 152.1 –0.4% 0.0% –13.2% –3.0% +3.5%
Glob IG Corp (Hedged CHF) CHF 177.6 –0.8% +0.4% –16.7% –2.0% +6.4%
Glob HY Corp (Hedged CHF) CHF 323.6 –0.5% +3.6% –13.6% +1.4% +3.7%
USD EM Corp (Hedged CHF) CHF 255.5 –1.5% +0.6% –18.2% –2.7% +4.3%
Government bonds 31.08.2023 08/2023 2023 YTD 2022 2021 2020
SBI Dom Gov CHF 173.2 +0.8% +8.5% –17.0% –4.2% +2.1%
US Treasury (Hedged CHF) CHF 139.4 –0.9% –2.1% –15.0% –3.5% +6.3%
Eurozone Sov (Hedged CHF) CHF 175.7 +0.1% +1.4% –18.9% –3.7% +4.6%
Corporate bonds 31.08.2023 08/2023 2023 YTD 2022 2021 2020
CHF IG Corp (AAA-BBB) CHF 177.1 +0.5% +3.0% –7.5% –0.5% +0.5%
USD IG Corp (Hedged CHF) CHF 181.6 –1.2% –0.2% –18.5% –2.3% +8.0%
USD HY Corp (Hedged CHF) CHF 562.8 –0.1% +4.1% –13.7% +4.1% +5.1%
EUR IG Corp (Hedged CHF) CHF 158.7 0.0% +2.1% –14.1% –1.2% +2.4%
EUR HY Corp (Hedged CHF) CHF 273.6 +0.1% +4.6% –10.9% +3.2% +2.1%
Alternative investments 31.08.2023 08/2023 2023 YTD 2022 2021 2020
Gold Spot CHF/kg CHF 55'103.8 +0.0% –0.5% +1.0% –0.6% +14.6%
Commodity Index USD 106.0 +0.3% –10.0% +15.1% +30.8% –11.6%
SXI SwissRealEstateFunds TR CHF 2'166.7 –2.5% –2.4% –17.3% +7.6% +13.0%
Currencies 31.08.2023 08/2023 2023 YTD 2022 2021 2020
US dollar / Swiss franc CHF 0.8834 +1.3% –4.4% +1.3% +3.1% –8.4%
Euro / Swiss franc CHF 0.9579 –0.1% –3.2% –4.6% –4.0% –0.4%
100 Japanese yen / Swiss franc CHF 0.6070 –0.9% –13.9% –11.0% –7.5% –3.8%
British pound / Swiss franc CHF 1.1195 +0.0% +0.1% –9.3% +1.9% –5.7%
Back to News