Liquidity, currency
Interest rates at the shorter end are more attractive
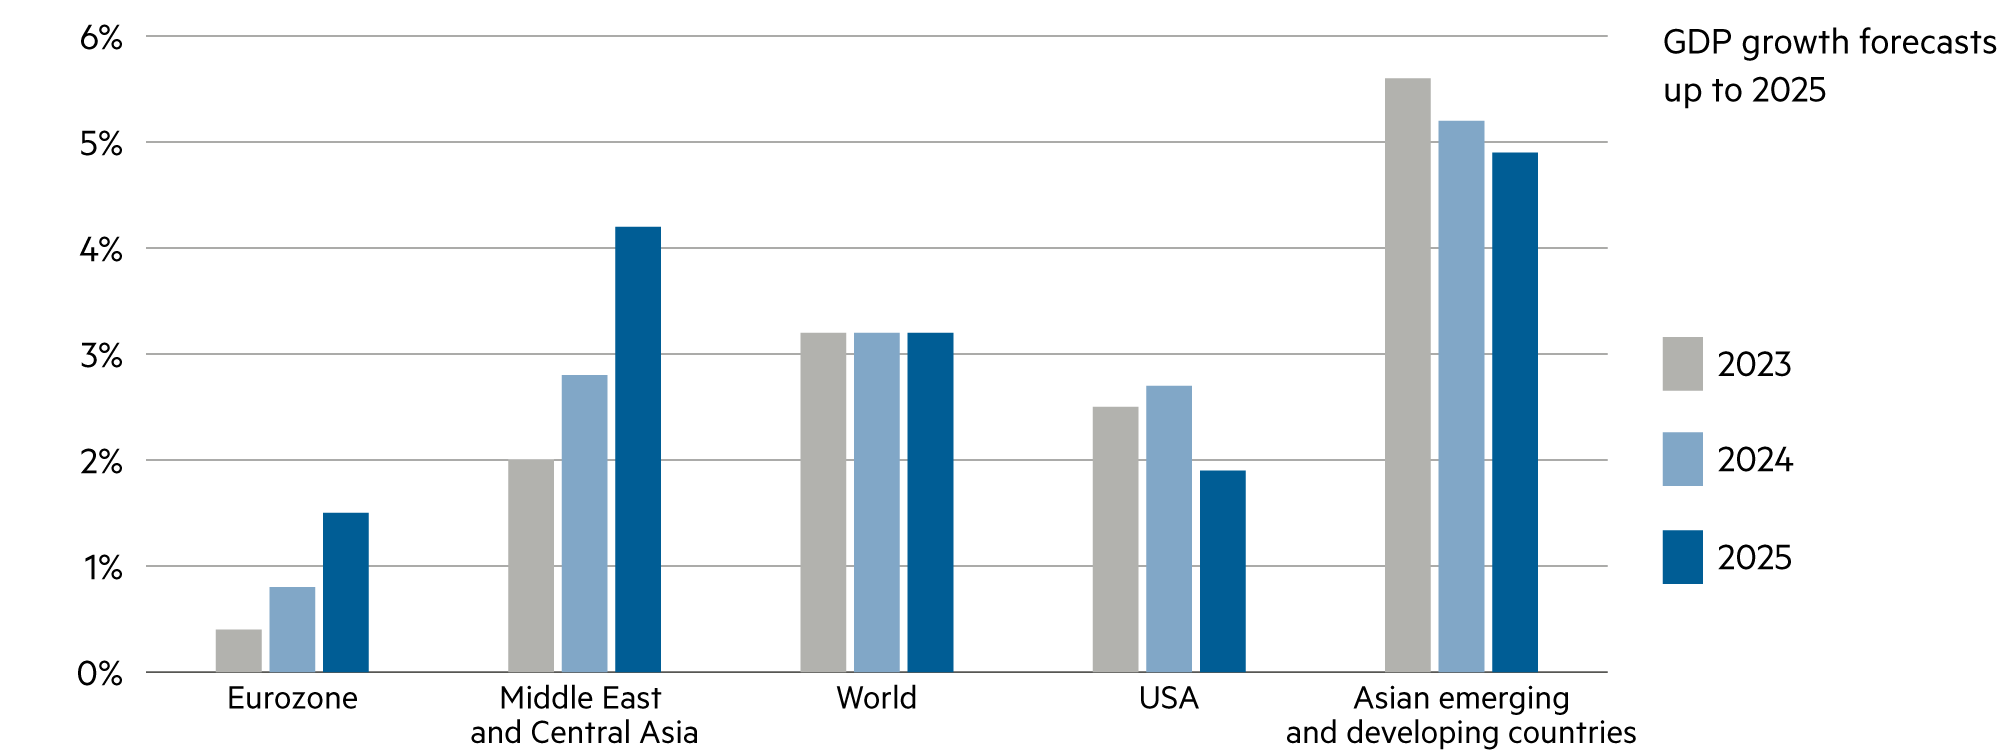
The fact that the US budget deficit continues to grow month after month should not be news to anyone. The timing of actual borrowing, i.e. when the US Treasury will have to issue and sell new bonds, is already more complex. This depends on the exact timing of maturing bonds that need to be rolled over, as well as larger expenditures such as the recent aid packages for Ukraine and Israel. The USA has to pay significantly more interest on its debt in the short, medium and long term than the eurozone or Switzerland.
Read more Close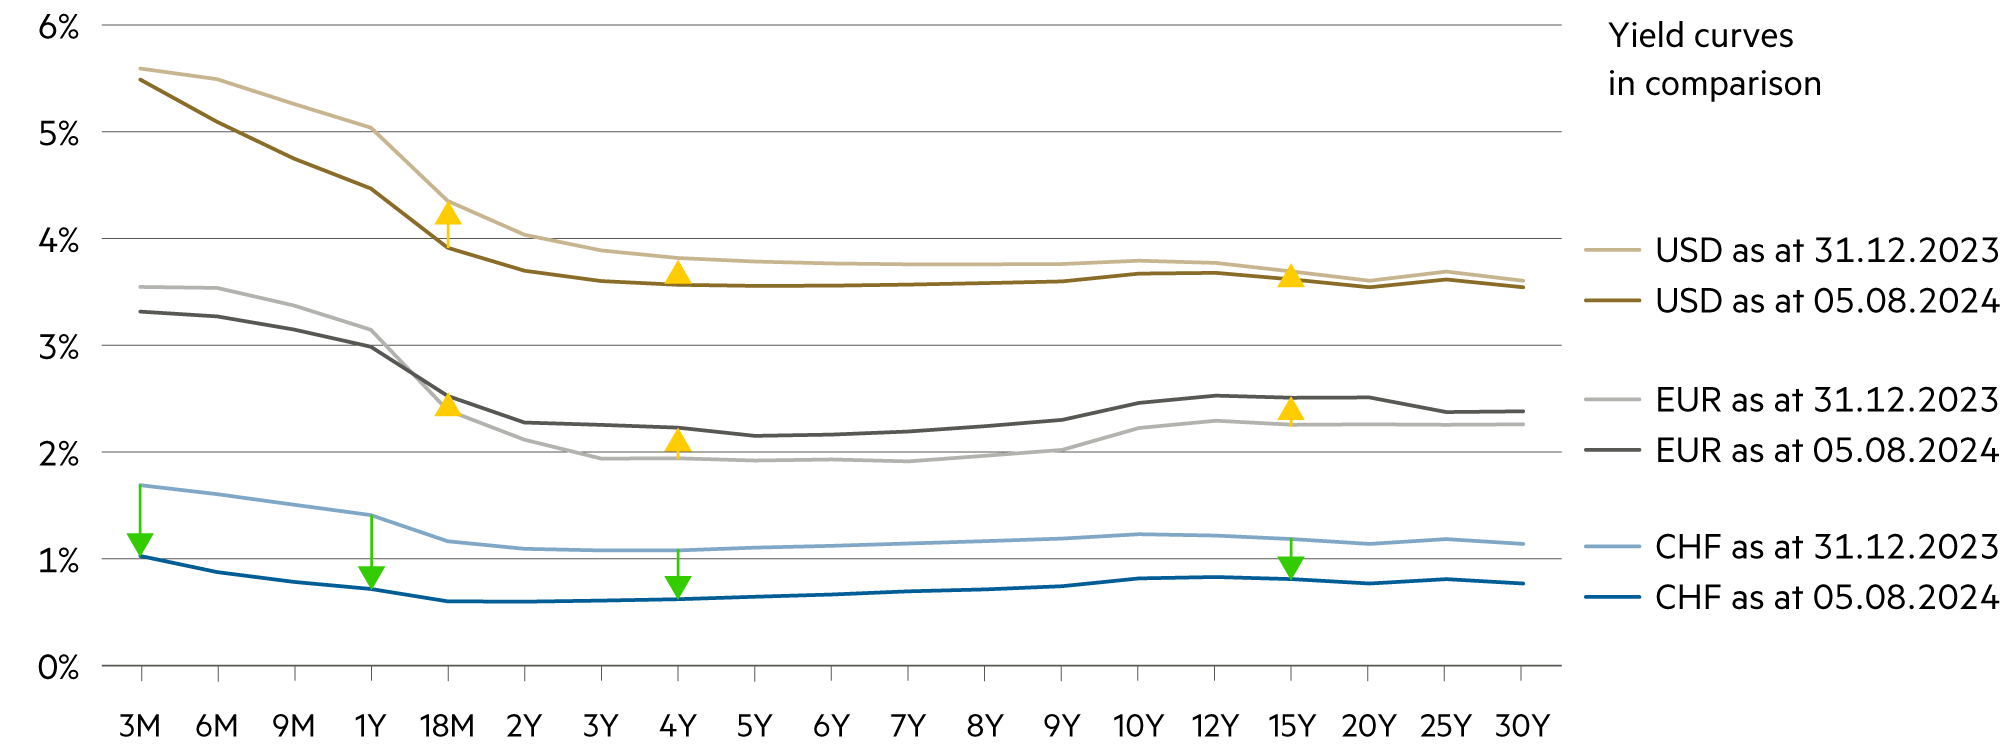
The Ministry of Finance, led by Janet Yellen, recently sold more short-term debt instruments than usual – presumably because it expects interest rates at the short end of the yield curve to fall and is aiming to renew them at a significantly lower level in a year’s time. However, selling short-term T-bills is no longer so easy, especially as demand from home and abroad is waning. Private investors are massively reducing their holdings because they also expect interest rates to fall and are increasingly shifting their capital to more promising markets.
In general, it is important to remember that the adjustment to the new environment with lower inflation and moderate macroeconomic risks has so far been largely orderly. This should not be taken for granted. When many attractive investment opportunities present themselves, the journey can be bumpier than expected.
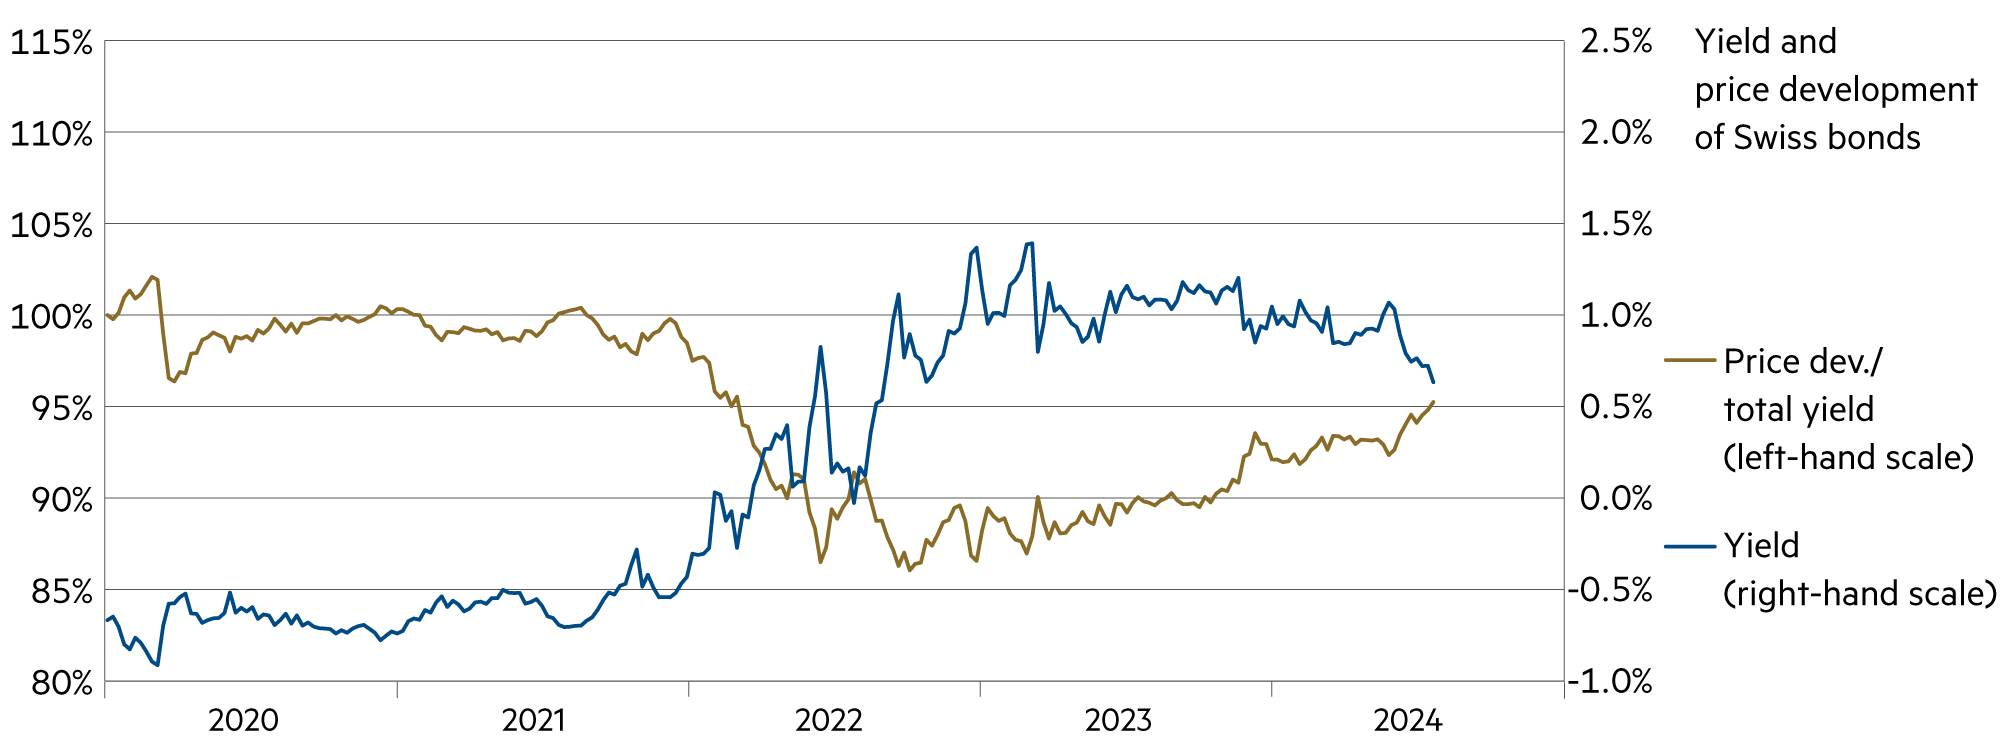
To date, it remains remarkable that despite isolated inflation disappointments, there has been less bond volatility in the first half of 2024 than during the period when interest rates were on their way up. Many seem to realize: When interest rates are rising, the destination is worryingly uncertain; on the way down, despite the ups and downs of individual macroeconomic data, we know the end point is somewhere between zero and where we are now. This obviously has a calming effect and reduces volatility.
This also results in a focus for the next twelve months: the preference for the middle points of the yield curve. This is where interest rates will fall, particularly in the USA. Because yields at the shorter end of the yield curve are primarily determined by key interest rate expectations, the highest interest rates are effectively capped and will ensure an upward movement in the total yield of medium-term bonds.
The extent of this remains uncertain, but we are keen to benefit from it. By contrast, the medium-term yield prospects on the Swiss franc yield curve have diminished due to the Swiss National Bank’s rapid monetary policy adjustment to the renewed inflation environment.
Further out on the curve, interest rates are somewhat higher than at the start of the year (with the exception of Switzerland) and have caused price losses on the corresponding USD and EUR bonds. Added to this are the costs of currency hedging. A number of other factors are also determining yields at the longer end of the yield curve: for example, concerns about the sustainability of US government debt through to uncertainty about growth trends and the term premium. These considerations ensure that the upside and downside risks are currently symmetrical.
| Asset class | 3–6 months | 12–24 months | Analysis |
|---|---|---|---|
| Bank account |
|
|
There are further signs of easing on the inflation front. The interest rate on bank accounts is once again tending towards zero. |
| Euro / Swiss franc |
|
|
The ECB is likely to cautiously lower its key interest rates further after the summer break. Purchasing power parity is roughly at the current level. |
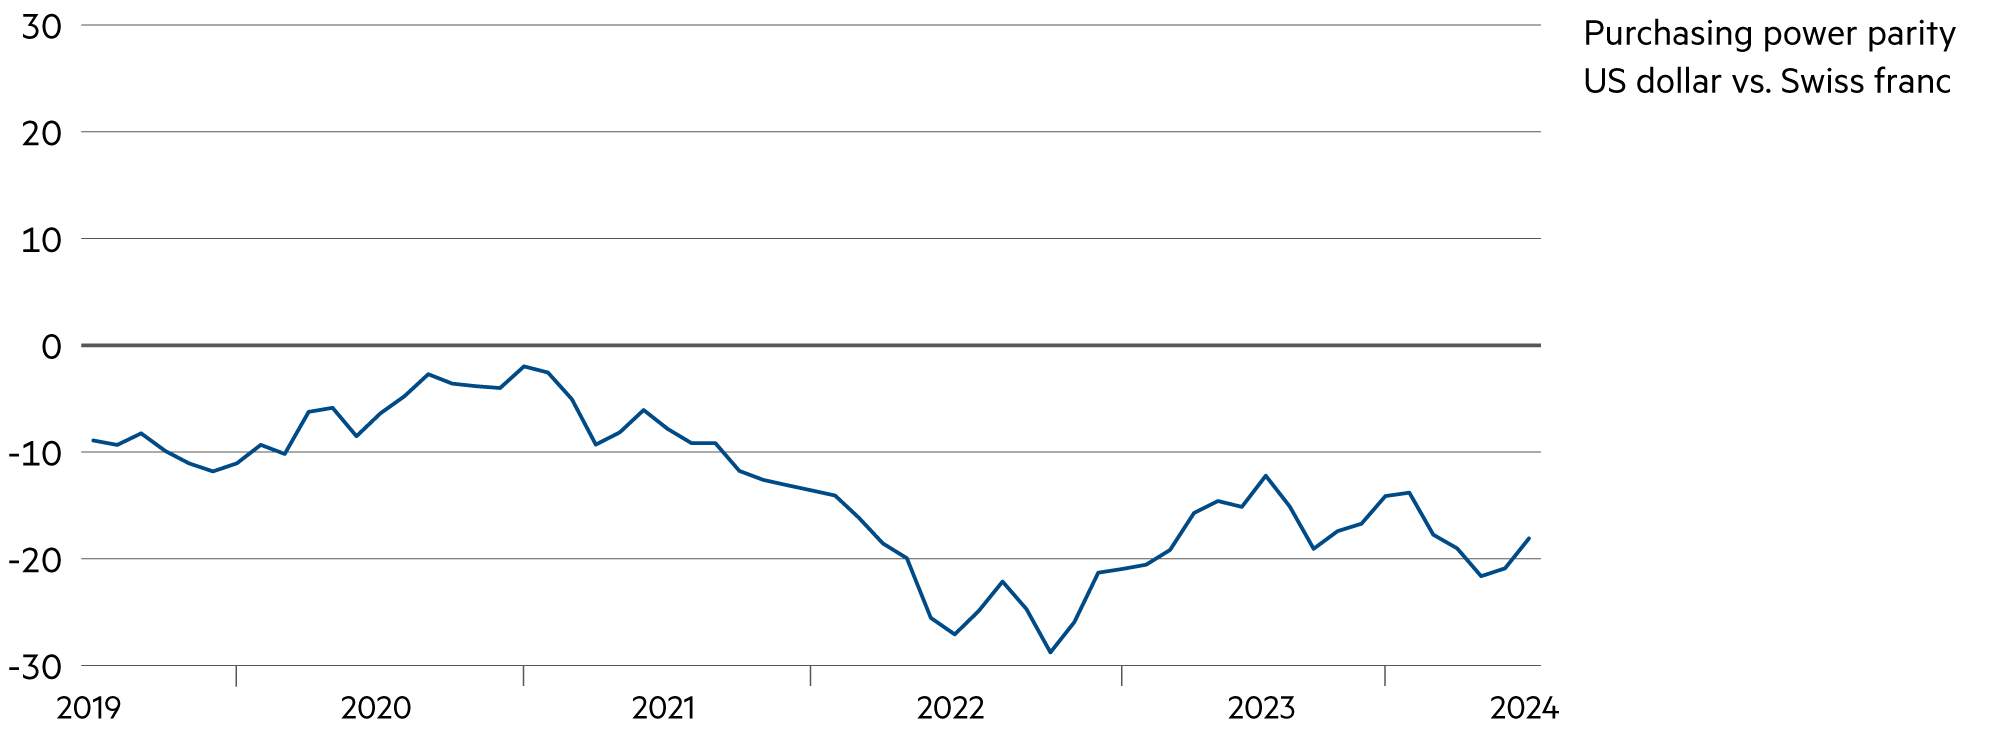
| US dollar / Swiss franc |
|
|
At just under 0.88, the dollar is at a low level due to interest rates (-2.3% in July). However, the annualized hedging costs of 4.2% (USD vs. CHF) remain high. |
| Euro / US dollar |
|
|
The euro clearly gained against the dollar in July (+1.1%). This trend could continue until the end of the year. |