Monthly Report 11/2024

Baar and the town of Zug with a panoramic view of the Alps (Photo: Andreas Busslinger)
Publications

Prospects of a year-end rally

After the US elections, it is fair to say that 2024 is likely to be one of the better vintages. The US elections are over and there are only a few weeks left until the end of the year. An uncertainty relief rallye started, and it paves the way for a year-end rally.

In the uncertainty surrounding the election outcome, numerous investors remained defensively parked with cash, but an investment wave is now likely to emerge. This is derived from a good set of data. Now that reporting for the third quarter has again surprised mostly on the upside, earnings estimates for the coming year are again on the rise. In addition, consumer confidence in the US and Europe has risen to its highest level since March 2021.

Inflationary pressure is easing and the terrible inflation wave has been overcome. In the US, the personal consumption expenditures price index is only 2.1% higher than a year ago – even though the US economy has been growing at an annualized rate of 3% for more than half a year.

Goods price inflation is even in slight negative territory, with only service prices (especially housing) higher than a year ago. In Europe, too, inflation is back within the central banks’ target zone in many places. Here, it is imperative that the restrictive monetary policy course adopted to date be relaxed to prevent the economy from sliding into a deflationary phase. Spain, Italy and France are growing significantly, Germany (+0.8% in the third quarter) somewhat less.

On both sides of the border, the labor markets are almost in equilibrium. Unemployment rates are low and hourly wages and the employment rate are stagnating at a good level. The central banks are evaluating the individual data and are still weighing up each interest rate move. It is certainly not yet back to normal, where monetary policy could be on autopilot.

The SMI with an interim low

The Swiss Market Index, like other markets, experienced an interim low before the US elections. The SMI is thus around 17% higher than 12 months ago in terms of its total return. In 2023, there was a year-end rally in November and December, and we could see something similar this year.

The broad US S&P 500 index has risen significantly since the beginning of the year (+19.6% in USD). In Europe, valuations are more moderate and the rise so far (+6.8% for the Euro Stoxx 50) is rather modest, as it is for the SMI (+5.9%).

European automobile stocks and their (Swiss) suppliers as well as luxury goods stocks have suffered in particular as a result of sluggish consumption in China.

The global bond index had a poor month (-0.7% year to date, -1.8% in October) due to concerns about high government debt around the world and the question of whether this will lead to higher yield pressure in the future. In any case, bond yields rose worldwide and prices fell.

However, the average yield on our bonds was only slightly negative, but a slightly negative monthly result was unavoidable in the portfolios with a high bond component. As a result, all solutions showed a negative monthly result.

Strategies mainly based on individual titles Strategy performance*
October 2024 YTD 2024
Zugerberg Finanz R1 –1.6% +1.7%
Zugerberg Finanz R2 –1.5% +5.3%
Zugerberg Finanz R3 –1.4% +8.8%
Zugerberg Finanz R4 –1.7% +10.0%
Zugerberg Finanz R5 –1.7% +10.5%
Zugerberg Finanz RDividends –2.3% +7.3%
Zugerberg Finanz Revo1 –1.3% +1.4%
Zugerberg Finanz Revo2 –1.2% +5.0%
Zugerberg Finanz Revo3 –1.2% +7.6%
Zugerberg Finanz Revo4 –1.7% +9.7%
Zugerberg Finanz Revo5 –2.0% +11.0%
Zugerberg Finanz RevoDividends –2.3% +7.8%
Zugerberg Finanz DecarbRevo3 –2.3% +0.1%
Zugerberg Finanz DecarbRevo4 –3.2% –1.3%
Zugerberg Finanz DecarbRevo5 –3.7% –2.3%
Zugerberg Finanz Vested benefits Strategy performance*
October 2024 YTD 2024
Zugerberg Finanz Vested benefits R0.5 –1.2% +0.6%
Zugerberg Finanz Vested benefits R1 –1.1% +2.3%
Zugerberg Finanz Vested benefits R2 –1.0% +4.5%
Zugerberg Finanz Vested benefits R3 –0.8% +7.5%
Zugerberg Finanz Vested benefits R4 –1.7% +7.3%
Zugerberg Finanz 3a pension solution Strategy performance*
October 2024 YTD 2024
Zugerberg Finanz 3a Revo1 –1.3% +1.4%
Zugerberg Finanz 3a Revo2 –1.2% +5.0%
Zugerberg Finanz 3a Revo3 –1.2% +7.6%
Zugerberg Finanz 3a Revo4 –1.7% +9.7%
Zugerberg Finanz 3a Revo5 –2.0% +11.0%
Zugerberg Finanz 3a RevoDividends –2.3% +7.8%
Zugerberg Finanz 3a DecarbRevo3 –2.3% +0.1%
Zugerberg Finanz 3a DecarbRevo4 –3.2% –1.3%
Zugerberg Finanz 3a DecarbRevo5 –3.7% –2.3%
* The stated performance is net, after deduction of all running costs, excluding contract conclusion costs

Macroeconomics

World economy between cooperation and confrontation

The global economy is highly interconnected, as the pandemic has starkly demonstrated. That is why western countries and companies in particular are aiming to make supply chains more robust in the face of possible disruptions in the international movement of goods and services. However, the outcome of the US election also brings further economic uncertainties, especially in strategically important areas.

Read more Close
Risks and uncertainties in the global economy (Graphic: Zugerberg Finanz)

According to the International Monetary Fund (IMF), the global economy’s potential for growth remains intact overall. The global economy is expected to grow by +3.2% in real terms in the current and next year. More would be possible, but regulations and trade barriers have been erected at a record pace in recent years.

Donald Trump’s election could be accompanied by a further wave of drastic tariff increases, an expansive fiscal policy and a sharp restriction on immigration. Where tariffs are levied, counter-tariffs are to be expected. It therefore seems plausible that we are not heading for greater continuity in trade and economic policy, but rather that we must expect erratic decisions and, increasingly, negative effects.

Higher import tariffs lead to higher prices for imported goods. Even higher deficits due to fiscal stimulus programs are likely to push up yields on government bonds because risk premiums are likely to rise. In such a scenario, a significant increase in inflation in the US is possible, which could prompt the US Federal Reserve to raise key interest rates.

If Trump’s announcements were to be implemented, this could lead to a noticeable decline in growth in the eurozone and also in Switzerland. “This would not only be due to the consequences of significantly higher tariffs, which would directly or indirectly affect our export industry. It would also be due to the significant uncertainty that a Trump victory would trigger in Europe. It could reinforce the tendency for companies to hold back on investments,” explained Joachim Nagel, President of the German Bundesbank, recently.

Due to Switzerland and the Federal Republic of Germany’s above-average trade links with the US compared to the rest of the eurozone, the negative effects for Switzerland and Germany could be greater than for the eurozone. For example, in 2023 Germany was by far the largest European exporter to the US. The share of exports to the US in total exports was also higher than in most EU member states.

In this scenario, the sharp turn in US trade and economic policy could also entail inflation risks for Europe. The main channel for this would be exchange rate developments, influenced by US monetary policy: if the Fed were to respond more strongly to a surge in US inflation by raising interest rates than the Governing Council of the European Central Bank (ECB) would to price developments here, a depreciation of the euro would be expected, and with it a rise in import prices.

Region 3–6 months 12–24 months Analysis
Switzerland After the SNB is expected to have made a profit of more than 60 billion francs by the end of September, hopes of a distribution are rising.
Eurozone, Europe With low inflation, consumer confidence is also returning in Europe. The south is growing into the role of engine.
USA US consumer confidence jumped to 108.7 (+9.5 points), the highest level since March 2021, reflecting a healthy labor market. New highs in small caps are to come.
Rest of the world At present, caution is advised with regard to Chinese equities, as the effects of the trade disputes with the US are completely unclear.

Liquidity, currency

The big wave of inflation is over

The worst phase, with inflation rates in the US and Europe sometimes in double digits, is over. At present, many economies are well on the way to achieving their inflation targets on a sustainable basis. This also applies to Switzerland, where the inflation target is in the range of 0% to 2% and the inflation rate over the past 12 months was 0.6%. Therefore, even the central banks – such as the Federal Reserve (Fed) – are forecasting falling key interest rates in the coming quarters.

Read more Close
Implied US central bank key interest rates until 2027 (Source: U.S. Federal Reserve, 18 September 2024 | Graphic: Zugerberg Finanz)

The capital market is currently expecting US key interest rates to be cut five times by 0.25% each time over the next 12 months – to a target range of 3.5% to 3.75%. This means that the market is not quite as optimistic as the Fed. The differences are not large, and individual macroeconomic data can quickly change the market opinion again.

The biggest change was the strong growth in the US, which can also be attributed to robust consumption and the low savings rate. Many fail to understand the fundamentally different savings behavior between the US and Europe.

In the US, saving is primarily done with equities, while in Europe low-yield bank savings solutions predominate. When stock markets rise (the broad US S&P 500 index is up around 20% in the current year), there is a significant wealth effect. Anyone who set aside $200’000 at the beginning of the year now has $240’000 – without any additional savings.

In Europe, bank savings are particularly popular. In Germany alone, 2’200 billion euros are parked in demand deposits or cash: only a fraction of this is invested in equities. This has devastating long-term consequences, also this year: those who had 200’000 euros will end up with between 204’000 and 208’000 euros, depending on the account solution. This does not even compensate for the loss of purchasing power due to inflation.

To achieve the individual savings target, considerably more must be set aside with this investment solution. Only in this way can the gap to the typical US household be reduced. The propensity to consume is therefore lower, which hardly encourages companies in this country to invest more. By contrast, robust consumption is the key growth driver of the entire US economy because it encourages companies to invest.

Furthermore, although the US, with 350 million inhabitants, has a lower sales potential than Europe, with almost 600 million inhabitants (excluding Russia), the market is fairly homogeneous from coast to coast. By contrast, Europe’s economy is fragmented into numerous countries with different regulations, languages, cultures, and trade and economic alliances.

However, this diversity also gives rise to a rich culture of innovation. Europe can certainly benefit from geoeconomic fragmentation, because the reshoring of production facilities to low-wage Eastern and Central European countries or to high-quality, 24/7 Western European factories is already proving successful in many areas. More people in Europe have jobs than ever before. At least this is a sign of a good degree of resilience.

Asset class 3–6 months 12–24 months Analysis
Bank account Interest on time deposits is falling sharply and is trending towards 0.5%. With inflation at 0.6%, this is less than the rate of price increases.
Euro / Swiss franc The ECB is likely to cut its key rates further at its next meetings (December 12, January 30 and March 6) by 0.25% each time.
US dollar / Swiss franc The dollar is trading at a forward rate of 80 cents at the end of October 2024, i.e. despite high interest rates, there is a significant risk of depreciation.
Euro / US dollar At 1.09 at the beginning of November, the exchange rate is back in the middle of the range of the past 12 months. We will probably see a little lighter Euro.

Bonds

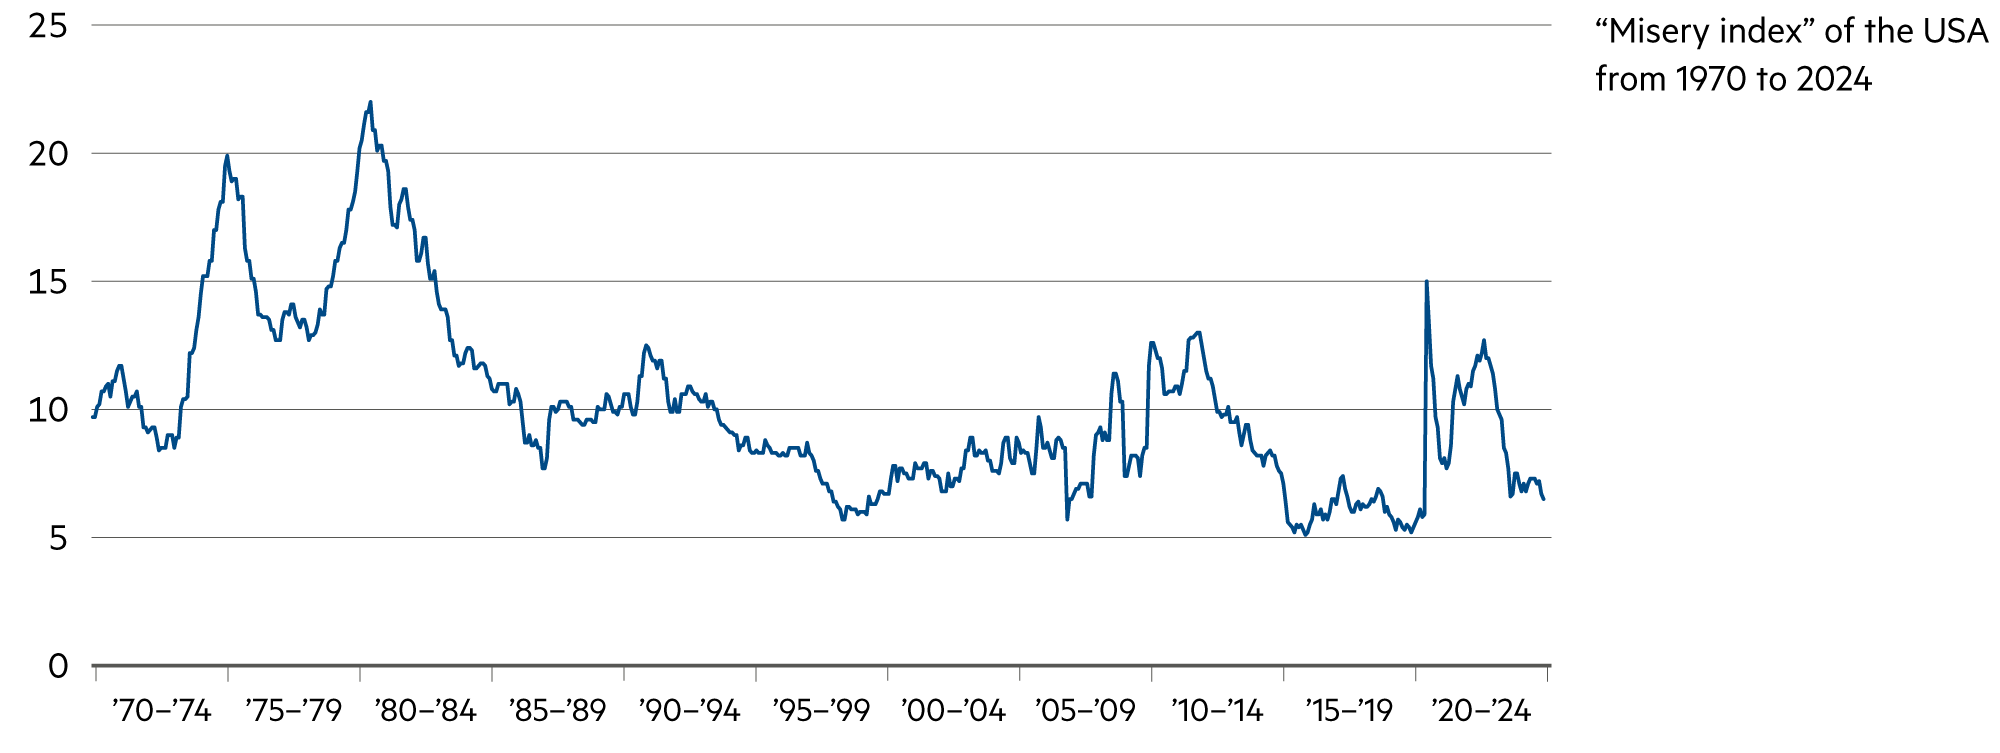
The misery index has fallen sharply

The closely watched Misery Index, which adds up unemployment and inflation to measure economic “misery”, has fallen to a low 6.5% in the US. Since 1970, it was only a few months lower in the pre-pandemic phase. In Europe, the index value is also very low. This means that higher yields could well become the norm on the bond markets again. A return to negative interest rates can be ruled out for the time being.

Read more Close
The ‘misery index’ in the USA is at a low level (Source: Bloomberg Finance L.P. | Graphic: Zugerberg Finanz)

After hitting a low in mid-September, the yield on two-year US government bonds has risen by almost 50 basis points. Yields on five- and ten-year bonds have both risen by around 60 basis points to 4.2% and 4.4% respectively. Accordingly, bond prices have fallen, especially for long-dated bonds.

The global bond index, which is heavily weighted towards US Treasuries, is marking time. For the year to date, the return is negative (-0.7%). But a look at the past three years does not provide any more insight either, with a total return of -12.0%. Since the crash in 2022 (-13.7%), there have been handsome interest payments, but hedging costs absorbed the bulk of this. Hedging a dollar position from a Swiss perspective currently costs just over 4.0%.

Nevertheless, we believe that a significant portion of dollar positions must be held in conservatively structured portfolios in particular. Their price performance is like a hedge that can be used to profit from recessive economic phases. In addition, liquidity is outstanding.

However, the economic outlook is very good and robust at the moment, so now is probably not a good time to buy long-term US Treasuries.

In fact, it is possible that the costly implementation of election promises will cause the government budget deficit to rise rapidly again, which could herald the beginning of a surprisingly sustained rise in yields.

Bond yields have also risen recently because, after a weak start to August, a number of US releases provided positive surprises in September and October, including positive macroeconomic reports on wage and salary developments and retail sales data.

Last week’s US purchasing managers’ indices, new home sales and jobless claims further strengthened this trend. The Atlanta Fed’s model for real-time gross domestic product (GDP) tracking indicates that US growth remains between 2.3% and 3.3%.

Meanwhile, rising risk in the Middle East and uncertainty surrounding the war in Ukraine after the impending change in the White House are fueling concerns about inflation and fiscal sustainability.

It’s hard for us to imagine that next year, with GDP growth above 2.5% and stubborn service inflation, the Fed will automatically cut rates one after the other, easing the interest rate landscape worldwide.

Asset sub-class 3–6 months 12–24 months Analysis
Government bonds US Treasuries are attractive for USD investors. However, after the costs of currency hedging, there is nothing left for the CHF investor.
Corporate bonds Credit risk premiums for corporate bonds are low, but they do at least provide additional income compared to government bonds.
High-yield, hybrid bonds In this area, we look for robust debtors with solid business models and achieve multi-year returns of 3% and more (in CHF).

Zugerberg Finanz bond solutions

Solid contribution from our bond solutions

Bonds have continued to recover in the current year. The Credit Opportunities Fund (COF), which focuses on credit risk premiums, posted the strongest gains. With its return (+6.6% in Swiss francs), it is one of the best bond solutions in Europe. The conservatively oriented Zugerberg Income Fund (ZIF) would have performed particularly well in the event of a recession. With its total return, it still significantly outperforms the world bond index (-0.7% since the beginning of the year), even after ten months (+0.7%).

Read more Close
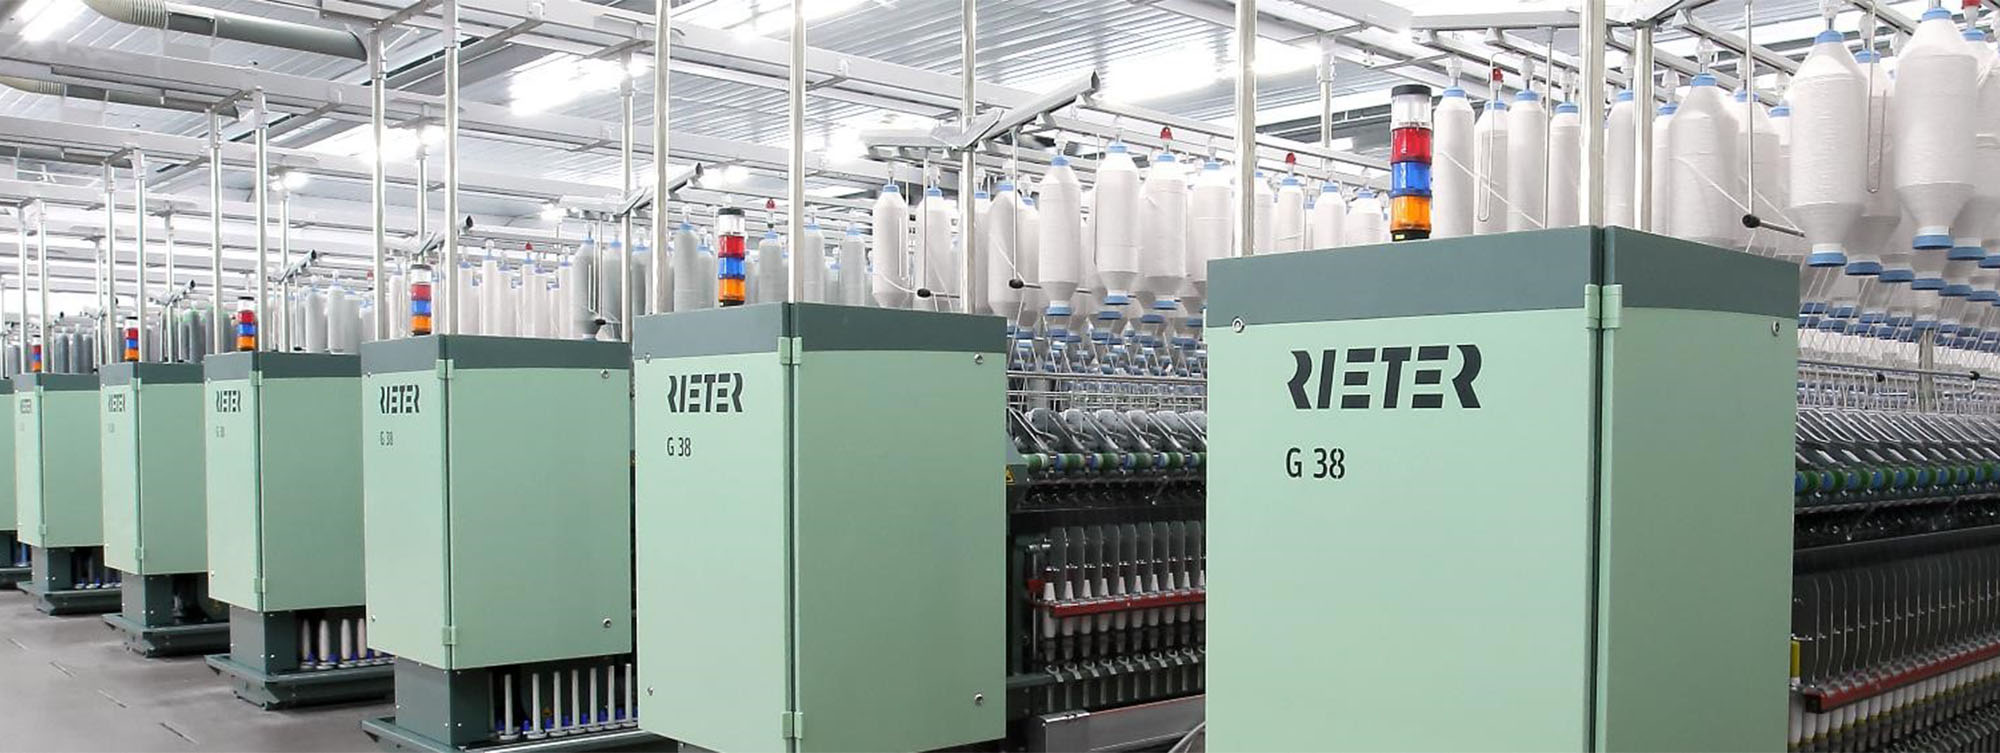
Rieter Textile Machinery (Image source: Rieter Fixed Income Investor Call, Oct. 2024)

The COF is characterized by low interest rate risks. Therefore, its fluctuations are small compared to bond solutions that are strongly oriented towards government bonds and their ratings. If one wants to describe the fluctuations of a security as risk, it is clear that a long-term bond – even with a high credit rating – is associated with a considerable risk of fluctuation (see also monthly report October 2024).

These are the bonds in the COF less. These are rather shorter-dated bonds. The main return is earned from risk premiums. This is the name given to the premium over a government bond. We purchased the 3% bond of the Swiss construction group Implenia in spring 2024 and a term of four years with well over 200 basis points above the comparable Swiss government bond.

In the meantime, the bond has risen from 100% to over 103% and the risk premium has fallen to 180 basis points. This still results in a yield of 2.0% over the remaining term.

The fluctuations of this bond are significantly lower than those of the ten-year benchmark bond of the Swiss Confederation and the total return is higher. This is precisely how the COF intends to position itself in the future. This is because the aforementioned government bond will generate an annual return of just 0.3% over the next ten years. In the COF, on the other hand, the expected return is the same, but it is paid monthly. This also takes into account economically challenging times.

If a bond becomes too expensive, it is sold before the maturity date. In January 2024, for example, we purchased a bond issued by the mechanical engineering group Bobst in Lausanne that matured in about four years at 100%. This was last trading at 103.50, which yields a little less than 1.7% over the remaining term.

We felt that this was insufficient, and the sales proceeds were subsequently invested in further, new bonds with significantly better total return prospects (e.g. textile machine manufacturer Rieter).

The solid economic development has recently supported the general credit environment. Credit spreads have narrowed in the past month despite the volatility in government bonds. They are lower at the end of October 2024 than they were on the eve of the 2016 election. But the outcome will not fundamentally cloud the good business outlook.

Zugerberg Income Fund Credit Opportunities Fund
Yield in 2024 (since the beginning of the year) +0.7% +6.6%
Yield since the start (annualized) -7.8% (-1.3%) +33.4% (+2.4%)
Proportion of months with positive yield 54% 67%
Credit risk premium in basis points (vs. previous month) 96 BP (-11 BP) 413 BP (-6 BP)
Average rating (current) A BB

Real estate, infrastructure

The airport is on the up

Over the past five years, we have always had a certain proportion of infrastructure stocks in our portfolios. These are typically characterized by relatively low volatility and high value retention. Despite the colossal damage that the pandemic caused to flight operations, loyalty paid off. The share price is now 16% higher and, with the dividend, there was a total return of 19%.

Read more Close
Zurich Airport: Share price performance over the last 5 years, 11/2019 to 10/2024 (Source: Bloomberg Finance L.P. | Graphic: Zugerberg Finanz)

It is easy to overlook what the situation was like in 2019. Interest rates were at a low level. We were concerned with diversifying our portfolios beyond equities, which are prone to volatility, into other, more defensive asset classes. We hoped for less volatility than with equities, but still a respectable return.

In this search, one inevitably comes across real estate and infrastructure topics. While real estate stocks, due to their strong interest rate sensitivity, show similar fluctuations as bonds with long maturities, infrastructure stocks have a different character. The core of the infrastructure business lies in a concession operation. For example, anyone who has a concession to operate an airport has a long-term license for a potentially profitable business in an orderly framework.

A regulator monitors the aviation fees, which limits the return on equity. However, investments in the fees can be included: the modern renewal of the baggage sorting and baggage handling system has increased the usage fees. In addition, the concessionaire is free to manage the existing area efficiently. Therefore, when it comes to earnings development, a distinction must always be made between aviation and non-aviation income.

Flughafen Zürich AG is a prime example of this. With well over a hundred properties at the airport and beyond (e.g. Balsberg, Circle), it is also a real estate company. However, its portfolio is less interest-rate sensitive and also has better long-term prospects (value appreciation potential). In the economically strong Zurich North area, the airport has numerous properties with development potential.

But the pandemic threw a spanner in the works. Dividends were canceled in spring 2020, 2021 and also 2022. The recovery of air traffic made it possible to resume a distribution in 2023. In spring 2025, the dividend should be more than 4 francs and dividend growth should accelerate in the coming years.

Passenger numbers are gradually increasing beyond 2019 levels, and passengers are spending significantly more on consumption. Gross profit will be lifted to a new record level over the next two years with an estimated 33 million passengers and 4% more flight movements. These profits are also needed to cope with the upcoming investments and the associated depreciation.

Asset sub-class 3–6 months 12–24 months Analysis
Residential properties CH The leverage effect is again taking hold: in the past, debt capital was the most important driver of returns in periods of falling interest rates and rising rents.
Office and retail properties CH With market interest rates for long-term mortgage loans soon to reach 1.5%, investing in good commercial real estate portfolios is also worthwhile.
Real Estate Fund CH Indirect real estate investment indices (SWIIT and CHREF) have gained significantly more than the SMI (+12.4% and +12.5%) in the year to date.
Infrastructure Equity / Fund The outlook for infrastructure operators remains intact in 2025: as their borrowing costs are falling, higher profits can be expected.

Equity

Solid outlook

In November and December, stock markets typically perform well for a variety of seasonal reasons. In addition, equities tend to perform better in phases when interest rates are being cut, provided the rate cuts are not induced by a deep recession. The outlook for equities also remains bright because the US elections have removed a major source of uncertainty and because earnings estimates for the coming year are on the rise. And not least because equity risk premiums have become attractive, particularly in Switzerland.

Read more Close
(Image source: stock.adobe.com)

The reporting season peaked in the last week of October. For some technology stocks, expectations were exceeded, for others not. At Alphabet (Google), investments in artificial intelligence led to a 35% increase in cloud revenues and YouTube advertising revenues rose significantly in the third quarter due to US election campaign spending. Total revenues reached USD 88.3 billion (+15%).

Apple’s AI-powered iPhone 16 series drove fourth-quarter sales to $94.9 billion. Amazon beat earnings and revenue expectations for the third quarter, driven by a 19% increase in AWS cloud revenues.

Ultimately, the shares of the big tech companies moved relatively unspectacularly from the beginning of the quarter until the beginning of November: Amazon was practically unchanged, Nvidia (+11%) and Alphabet (+3%) were slightly higher, and Microsoft (-6%) and Apple (-3%) were each slightly lower. In Europe, SAP and Deutsche Telekom (each +5%) as well as Holcim (+3%) were among the clear winners.

The fluctuations in the industrial sector were more pronounced. Sika (-14% since the beginning of the quarter) saw its latest earnings estimates revised upwards, but the share price moved in the opposite direction. Like Givaudan (-12%), Kühne+Nagel (-7%) and Partners Group (-6%), the construction chemicals company is one of the losers in phases of rising global yields and one of the winners when the trend is in the opposite direction.

The economic news from Europe was positive. Of the Stoxx 600 companies that have reported so far, 60% exceeded earnings estimates. Although the German economy grew at an annualized rate of 0.8% in the third quarter, which was not as strong as the Eurozone as a whole (+1.2%), German retail sales rose surprisingly in September (+1.2%).

The mood in the boardrooms of companies brightened surprisingly significantly in October. The business climate index rose to 86.5 points (+1.1 points compared to the previous month), as reported by the Munich-based Ifo Institute based on its survey of around 9’000 executives.

Consumer sentiment also improved again for the second month in a row. Consumers are apparently feeling better again about their personal circumstances than about national affairs. Unemployment in the EU remained at a record low of 5.9%.

Asset sub-class 3–6 months 12–24 months Analysis
Equity Switzerland The setback at the end of October, after several positive months, should not be misconstrued. The outlook remains attractive.
Equity Eurozone, Europe The European economy is in a recovery phase. But our disciplined selection of individual companies remains important.
Equity USA Not all technology stocks are expensive by any means. In fact, looking at the earnings trend of past years, some even appear cheap.
Equity Emerging markets In India, as a leading G20 growth nation, nominal GDP continues to grow at a rapid pace, which will benefit equities.

Alternative investments

Mastering potential turbulence with alternative investments

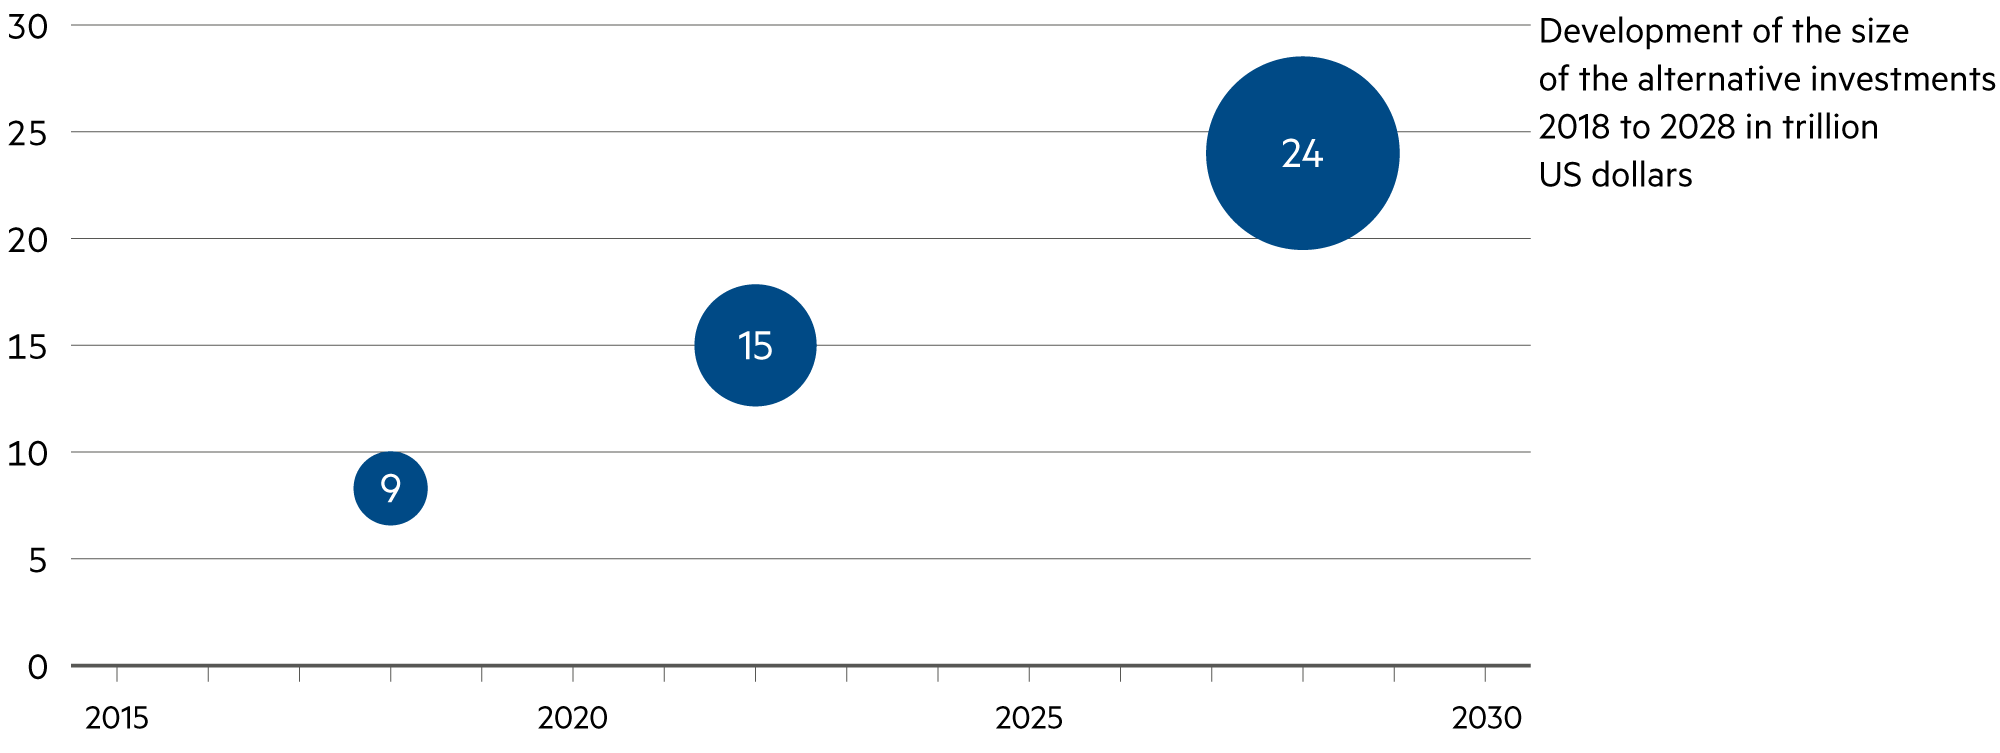
The alternative investments industry is expected to grow to more than $24 trillion in assets by 2028, up from $15 trillion in 2022. While these headlines may sound exaggerated in At the same time, more and more favorable attributes are emerging that could help investors weather potential turbulence in the capital markets.

Read more Close
Development of the size of alternative investments 2018 to 2028 (Source: Preqin Data Base, September 2024 | Graphic: Zugerberg Finanz)

What is important is that the industry has developed strongly. In the area of alternative investments, it is our view that each asset class has a few unique characteristics in terms of expected return, risk, income, liquidity and capital requirements. This requires a closer look to better understand the different advantages that each asset class can bring to a portfolio.

When a bank grants a loan, it has to back the transaction with equity. When a private market provider grants a loan from its private debt fund, it does not have to do so. Furthermore, the fund contributes to financial market stability. The investor places his capital in the private market manager’s corresponding vehicle for a fixed period of many years. The manager only receives a performance fee if all funds have been repaid and a pre-agreed minimum hurdle (e.g. 5% annually) has been exceeded. A typical bank’s compensation regime is designed to be comparatively short-term and also creates more instability because the loan can be terminated in a crisis. Mark Twain (1835 – 1910) once said: “A banker is a fellow who lends you his umbrella when the sun is shining, but wants it back as soon as it starts to rain.”

Bank balance sheets are vulnerable to crises of confidence because customer funds can quickly migrate. The best example of this was Silicon Valley Bank, which had over $175 billion in customer deposits. When rumors about the poor quality of its balance sheet emerged in spring 2023, payment orders for over 140 billion dollars were issued within 48 hours. The bank would have become insolvent had it not been taken over by the US deposit insurance agency FDIC.

In contrast, private market providers are long-term investors who do not operate with short-term customer deposits and can continue to grant loans even in crises. Companies in the portfolios of private market providers are less likely to go bankrupt than their bank-financed peers.

Financial market regulators are also demanding economic stress test scenarios from banks and their liquidity and capital adequacy because these are potentially much more crisis-prone than private market vehicles.

Some of the private market sub-asset classes serve more of a growth and capital appreciation purpose, while others protect against inflation and/or provide stable income.

Furthermore, the range of characteristics is broad and continues to expand as the innovative industry finds new ways to provide added value (e.g. an increased sense of security) to their end-users.

Asset sub-class 3–6 months 12–24 months Analysis
Commodities The global commodity index (Bloomberg Commodity Index, in dollars) stood at -0.6% in 2024 at the end of October and has been in the red for three years (-5.1%).
Gold, precious metals The price of silver has risen more strongly than the price of gold because there is industrial demand for silver (particularly in the solar industry).
Insurance Linked Securities Although the securitisation of insurance policies is largely decoupled from the volatility on the capital markets, the selection requires specialist knowledge.
Private equity We have no doubt that the good private market managers will be able to benefit from the secular upturn in the sector until 2030.

Summary

Asset class 3–6 months 12–24 months Analysis
Macroeconomics The world economy will grow by +3.2% in the coming year according to the International Monetary Fund's forecasts and inflation will slide back.
Liquidity, currencies Interest rates are likely to fall further in the coming 12 months. Possibly more so in the Eurozone than in the US. Least likely in Switzerland.
Bonds A key feature in October was the sharp increase in yields – both nominal and real – with steeper curves and higher volatility.
Real estate, infrastructure Real estate and infrastructure stocks are among our favorites for 2025 due to low volatility and high, reliable cash flow generation.
Equities A post-election recovery rally and rising profit outlook will boost equities in the coming weeks and months to new record highs.
Alternative investments The exit opportunities increase due to the coming low interest rate environment, which will raise the valuation of private market managers.

Market data

Asset class Price (in local currency) Monthly / YTD / Annual performance (in CHF)
Equity 31.10.2024 10/2024 2024 YTD 2023 2022 2021
SMI CHF 11'792.9 –3.1% +5.9% +3.8% –16.7% +20.3%
SPI CHF 15'711.6 –3.3% +7.8% +6.1% –16.5% +23.4%
DAX EUR 19'077.5 –1.4% +15.3% +13.1% –16.3% +10.4%
CAC 40 EUR 7'350.4 –3.9% –1.4% +9.6% –13.9% +23.6%
FTSE MIB EUR 34'281.2 +0.3% +14.3% +20.4% –17.3% +17.3%
FTSE 100 GBP 8'110.1 –3.2% +9.0% –0.3% –8.8% +16.7%
EuroStoxx50 EUR 4'827.6 –3.6% +8.1% +12.1% –16.0% +16.0%
Dow Jones USD 41'763.5 +1.1% +14.3% +3.5% –7.7% +22.2%
S&P 500 USD 5'705.5 +1.4% +23.3% +13.1% –18.5% +30.6%
Nasdaq Composite USD 18'095.2 +1.9% +24.3% +30.6% –32.3% +25.0%
Nikkei 225 JPY 39'081.3 –0.7% +11.5% +8.6% –19.7% –2.6%
Sensex INR 79'389.1 –3.9% +12.1% +7.4% –4.8% +23.2%
MSCI World USD 3'647.1 +0.4% +18.7% +10.8% –18.5% +23.7%
MSCI EM USD 1'119.5 –2.0% +12.8% –2.6% –21.5% –1.8%
Bonds (mixed) 31.10.2024 10/2024 2024 YTD 2023 2022 2021
Glob Dev Sov (Hedged CHF) CHF 153.7 –1.6% –1.1% +2.2% –13.2% –3.0%
Glob IG Corp (Hedged CHF) CHF 184.2 –2.0% –0.1% +4.2% –16.7% –2.0%
Glob HY Corp (Hedged CHF) CHF 358.8 –0.5% +5.7% +8.7% –13.6% +1.4%
USD EM Corp (Hedged CHF) CHF 273.7 –1.6% +3.1% +4.5% –18.2% –2.7%
Government bonds 31.10.2024 10/2024 2024 YTD 2023 2022 2021
SBI Dom Gov CHF 185.2 0.0% +3.2% +12.5% –17.0% –4.2%
US Treasury (Hedged CHF) CHF 138.5 –2.8% –2.3% –0.5% –15.0% –3.5%
Eurozone Sov (Hedged CHF) CHF 179.5 –1.2% –1.2% +4.8% –18.9% –3.7%
Corporate bonds 31.10.2024 10/2024 2024 YTD 2023 2022 2021
CHF IG Corp (AAA-BBB) CHF 188.9 +0.4% +3.9% +5.7% –7.5% –0.5%
USD IG Corp (Hedged CHF) CHF 186.7 –2.9% –1.0% +3.5% –18.5% –2.3%
USD HY Corp (Hedged CHF) CHF 608.0 –0.9% +3.7% +8.5% –13.7% +4.1%
EUR IG Corp (Hedged CHF) CHF 166.7 –0.5% +1.3% +5.9% –14.1% –1.2%
EUR HY Corp (Hedged CHF) CHF 300.4 +0.4% +4.6% +9.8% –10.9% +3.2%
Alternative investments 31.10.2024 10/2024 2024 YTD 2023 2022 2021
Gold Spot CHF/kg CHF 76'229.8 +6.4% +35.4% +0.8% +1.0% –0.6%
Commodity Index USD 98.1 +0.2% +2.5% –20.4% +15.1% +30.8%
SXI SwissRealEstateFunds TR CHF 2'631.7 +2.5% +12.5% +5.4% –17.3% +7.6%
Currencies 31.10.2024 10/2024 2024 YTD 2023 2022 2021
US dollar / Swiss franc CHF 0.8641 +2.2% +2.7% –9.0% +1.3% +3.1%
Euro / Swiss franc CHF 0.9403 –0.1% +1.2% –6.1% –4.6% –4.0%
100 Japanese yen / Swiss franc CHF 0.5678 –3.5% –4.8% –15.4% –11.0% –7.5%
British pound / Swiss franc CHF 1.1139 –1.5% +3.9% –4.2% –9.3% +1.9%
Back to News