Monthly Report 12/2025

Oberägeri, Canton of Zug, Switzerland (Photo: Andreas Busslinger)
Publications

The encouraging outlook for the economy and financial markets

After a period of high inflation, numerous trade policy challenges, and low growth, economic momentum in Europe is gaining strength. Fiscal stimulus is providing greater security and improving infrastructure. There is even hope for peace in Ukraine, which would provide further impetus. It is encouraging that the outlook for real growth is accompanied by moderate valuations on the European capital markets. This is all the more surprising given that the latest analyst estimates predict cumulative earnings growth of between 15% and 25% in Europe over the next two years.

The global bond index (+1.0% in CHF) and the Switzerland-related Swiss Bond Index (+0.9%) have risen slightly since the beginning of the year. After eleven months, our Zugerberg bond solutions are significantly above these benchmarks. However, the key performance drivers were investments in equities, real estate, and infrastructure. Characteristic of these three asset classes and their total returns after eleven months are the shares of Nestlé (+10%), PSP Swiss Property, and Zurich Airport (both +13%).

Bonds are also likely to contribute less to overall returns in the coming year. Their justification lies in providing less risk-tolerant portfolios with nominal values that are subject to lower volatility risks. In a real growing global economy, however, it cannot be overlooked that the most attractive returns in the long term are to be found in real assets.

Positive performance in November

The portfolios gained ground again in November. The low-risk strategies (Revo1, Revo2) saw slight growth of around +0.6%, while the growth was more pronounced in the equity-focused strategies (Revo5 +1.1%). Technology stocks such as Amazon and Microsoft (both -5%), SAP (-7%) and Nvidia (-13%) declined in November, as did the Bitcoin ETF (-17%). In contrast, numerous high-dividend stocks rose. As a result, dividend strategies saw the strongest performance gains in November and are now back in double-digit territory since the beginning of the year (RevoDividends +10.7%, RDividends +11.7%). This is all the more remarkable given that the performance of the global equity index (+5.7% in CHF) is significantly lower.

The performance of the Zugerberg 3a pension and Zugerberg vested benefits solutions was virtually identical. The dividend-focused strategy enjoyed a brilliant month thanks to Roche (+19%). However, we also attach great importance to high quality, convincing business models and rising free cash flows. In November, insurance companies such as Allianz (+7%) and Helvetia (+6%) as well as construction-related companies such as Geberit (+7%) and Holcim (+6%) performed well. Novartis (+5%) recently returned to its all-time high, and infrastructure companies such as Engie (+8%) and Vinci (+7%) also contributed to the strong performance.

Strategies mainly based on individual titles Strategy performance*
November 2025 YTD 2025
Zugerberg Finanz R1 +0.6% +1.8%
Zugerberg Finanz R2 +0.6% +2.5%
Zugerberg Finanz R3 +0.9% +3.4%
Zugerberg Finanz R4 +0.8% +3.6%
Zugerberg Finanz R5 +0.9% +3.6%
Zugerberg Finanz RDividends +2.6% +11.7%
Zugerberg Finanz Revo1 +0.6% +2.3%
Zugerberg Finanz Revo2 +0.5% +2.8%
Zugerberg Finanz Revo3 +0.7% +3.8%
Zugerberg Finanz Revo4 +0.9% +4.3%
Zugerberg Finanz Revo5 +1.1% +5.0%
Zugerberg Finanz RevoDividends +2.4% +10.7%
Zugerberg Finanz DecarbRevo3 –0.5% +12.5%
Zugerberg Finanz DecarbRevo4 –0.3% +15.0%
Zugerberg Finanz DecarbRevo5 –0.1% +17.1%
Zugerberg Finanz Vested benefits Strategy performance*
November 2025 YTD 2025
Zugerberg Finanz Vested benefits R0.5 +0.3% +1.0%
Zugerberg Finanz Vested benefits R1 +0.5% +2.1%
Zugerberg Finanz Vested benefits R2 +0.6% +2.7%
Zugerberg Finanz Vested benefits R3 +0.7% +4.4%
Zugerberg Finanz Vested benefits R4 +0.8% +4.3%
Zugerberg Finanz Vested benefits R5 +0.9% +3.6%
Zugerberg Finanz Vested benefits RDividends +2.6% +11.7%
Zugerberg Finanz 3a pension solution Strategy performance*
November 2025 YTD 2025
Zugerberg Finanz 3a Revo1 +0.6% +2.3%
Zugerberg Finanz 3a Revo2 +0.5% +2.8%
Zugerberg Finanz 3a Revo3 +0.7% +3.8%
Zugerberg Finanz 3a Revo4 +0.9% +4.3%
Zugerberg Finanz 3a Revo5 +1.1% +5.0%
Zugerberg Finanz 3a RevoDividends +2.4% +10.7%
Zugerberg Finanz 3a DecarbRevo3 –0.5% +12.5%
Zugerberg Finanz 3a DecarbRevo4 –0.3% +15.0%
Zugerberg Finanz 3a DecarbRevo5 –0.1% +17.1%
* The stated performance is net, after deduction of all running costs, excluding contract conclusion costs

Macroeconomics

Resilient global economy

The global economy is starting 2026 with surprising resilience. Growth forecasts have been revised upward in many places – the International Monetary Fund now expects global growth of 3.2% in 2025, supported by a recovery in economic activity despite ongoing trade conflicts. The outlook varies from region to region. Europe is regaining momentum and could grow by +1.6% in each of the next two years, assuming no peace scenario in Ukraine. Growth in the US is converging with that in Europe.

Read more Close
(Image source: stock.adobe.com)

Despite ongoing trade conflicts, global economic and trade activity is recovering. Europe, with a gross domestic product (GDP) of around $26 trillion, is regaining momentum, while the US GDP of $29 trillion is navigating political headwinds. Europe is now benefiting from a stable legal framework and a comprehensive realignment of financial and fiscal policy in Germany. This will accelerate growth, supported by higher spending on infrastructure and defense. The headwinds to European growth caused by increased uncertainty in trade policy, which culminated in April 2025, are likely to continue to ease. Companies that postponed their investments in the spring are now likely to invest more heavily again, as there is greater clarity about future trade agreements.

It is often underestimated that Europe has more academics than the US or China. It is no coincidence that Google employs almost 6,000 people in Zurich alone. The abundance of highly qualified workers with a strong work ethic in Europe is attractive to global companies. This is another reason why Europe is becoming an attractive location for venture capital.

The US, on the other hand, is facing a complex macroeconomic environment characterized by new political decisions such as tariffs and an economically unjustified loose fiscal policy. These are likely to fuel domestic inflationary pressure, which the US Federal Reserve (Fed) will not necessarily counteract, as it is currently more focused on the risks in the labor market (4.4% unemployment).

In Asia, China’s growth is likely to continue to slow, with GDP at around USD 19 trillion, with the government focusing more on targeted economic measures and investment in advanced manufacturing than on consumption. China is the global leader in factory automation and is ensuring sustained deflationary pressure with falling ex-factory prices. This is being transferred abroad through brisk export activity.

Commodity prices are also having a deflationary effect. Crude oil prices have fallen by 13% in dollar terms since the beginning of the year. Added to this is the weakening of the dollar, which has fallen by around 8% against all currencies worldwide. As a result, commodity prices in local currency are 20% lower in many places, significantly improving the trade balance, particularly in commodity-importing countries. This in turn strengthens the economic outlook, especially for emerging markets, in the coming quarters and years.

Region 3–6 months 12–24 months Analysis
Switzerland External economic uncertainties remain, but the Swiss economy is likely to benefit from the economic upturn in Europe.
Eurozone, Europe Inflation in the eurozone remains at its low target level. There is more cause for hope due to fiscal stimulus from Germany.
USA The wealth effect, which is primarily driving US consumption by wealthy households, can also become a strong headwind in a stock market slump.
Rest of the world Disappointing industrial data and concerns about the real estate market, which is characterized by record-high vacancy rates, are weighing on China's economy.

Liquidity, currency

The new stability of the euro

Since the beginning of the year, the euro has fluctuated within a narrow range against the Swiss franc. This new stability is welcome, as it compensates for the instability and increasing volatility of the dollar. The latter is linked to numerous monetary and fiscal policy uncertainties, while the eurozone is proving to be legally secure and stable in terms of value.

Read more Close
Swiss franc exchange rates since 1 January 2025 (Source: Bloomberg L.P. | Graphic: Zugerberg Finanz)

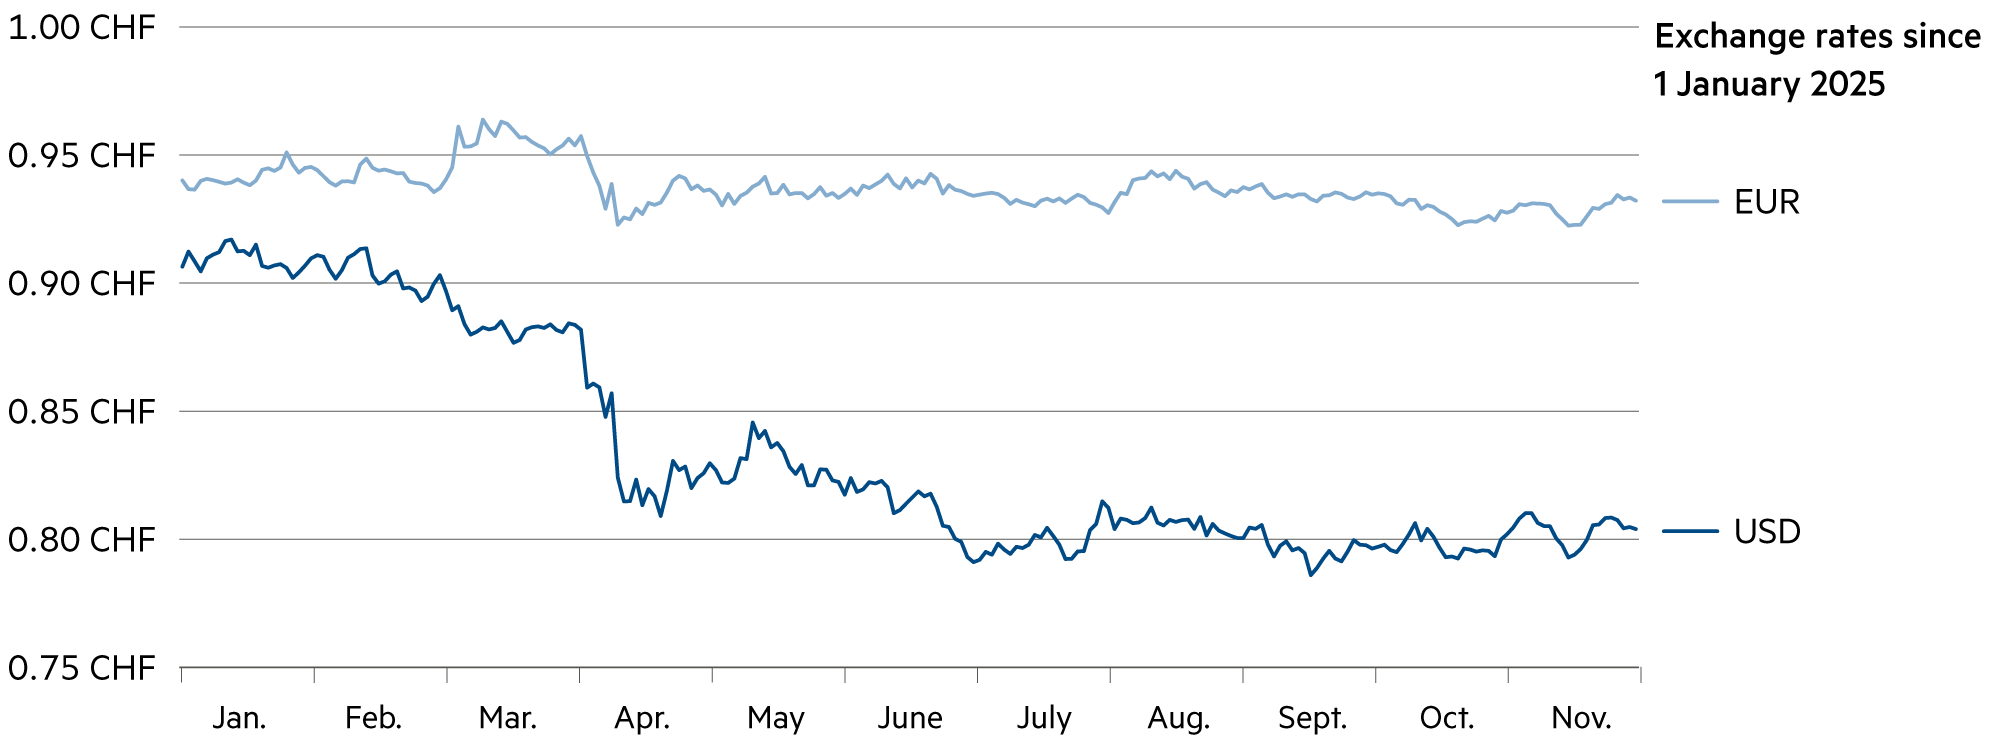
Since the beginning of the year, the Swiss franc has appreciated significantly more against the dollar (+12.6%) than against the euro (+0.8%). There is no inflationary pressure in either Switzerland or the eurozone. The factors that have driven disinflation – falling commodity prices and easing pressure on supply chains – have had a downward effect. Given the expected acceleration in economic growth, moderate wage increases and higher commodity prices could cause inflation to pick up again in 2026.

In addition, money supply growth continues to increase, which could intensify inflationary pressure over the next two years. However, there is likely to be further scope for disinflation in Europe in the coming years. The diversion of cheap Chinese exports from the US to European markets is creating a new disinflationary impulse that should allow the European Central Bank (ECB) and the Bank of England (BOE) to make further interest rate cuts by the end of 2026 – more than currently expected by the market consensus.

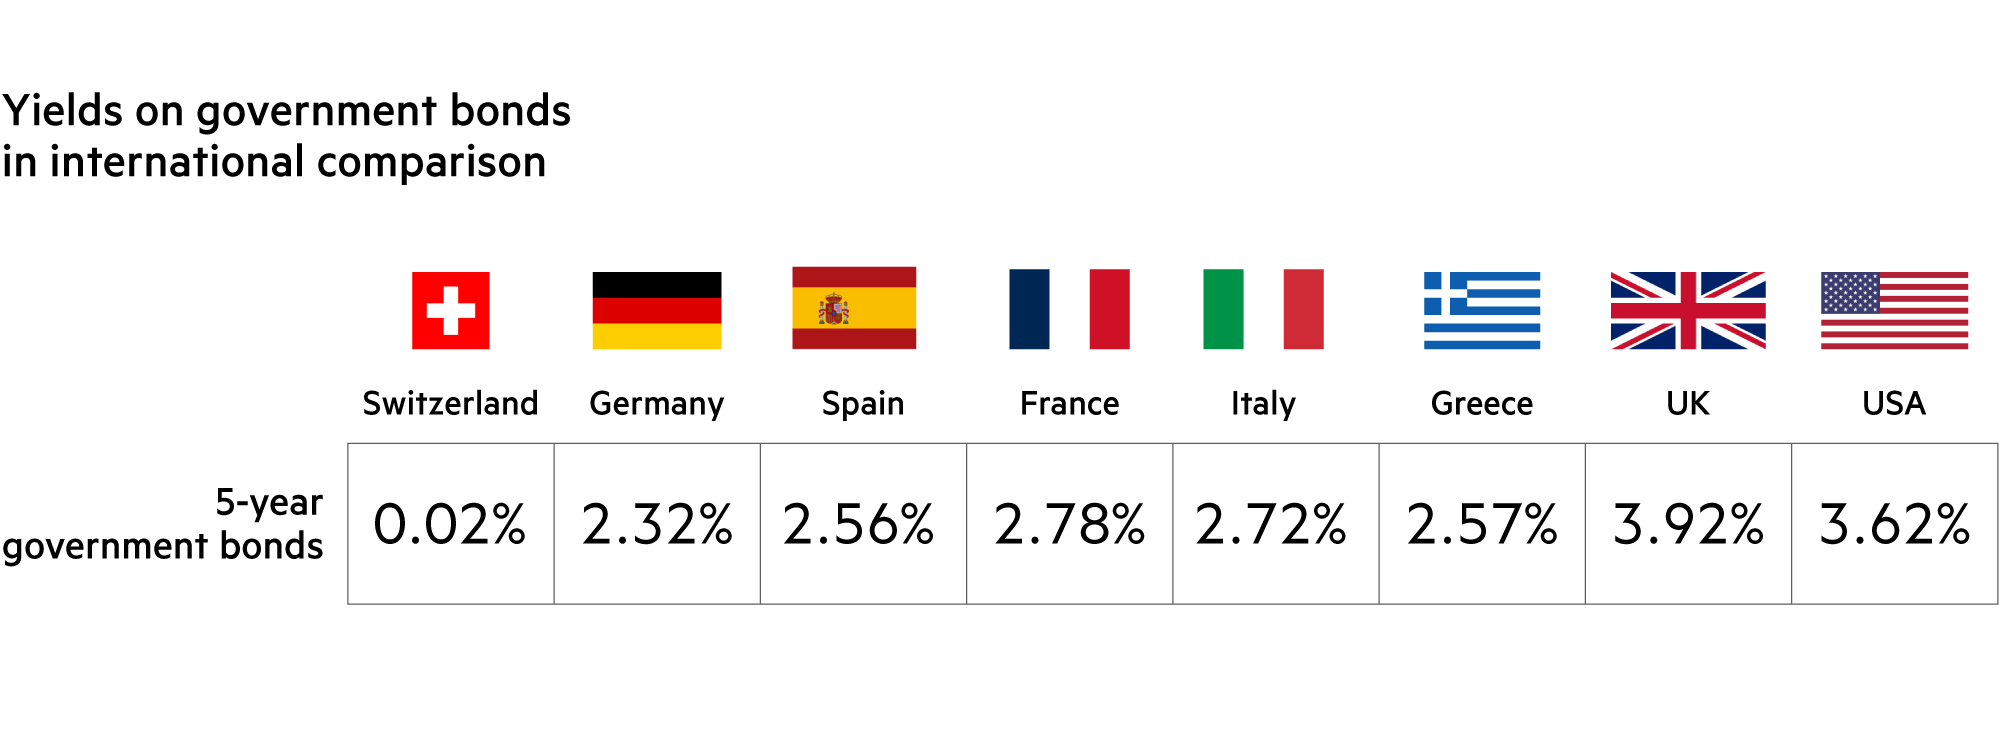
As an interesting addition to Europe, it is worth mentioning that Italy’s rating has been upgraded by Moody’s for the first time in 23 years. The Italian government budget is continuously generating a so-called primary surplus (before interest on debt).

President Donald Trump’s policies dominate the macroeconomic outlook for the US. Of course, the quantitative impact of each individual item on this agenda is debatable. But we know the direction. Higher tariffs, looser fiscal policy (tax cuts, especially for the richest 10% of households which account for 50% of all consumption) and stricter immigration policy are likely to increase inflationary pressure in the economy. At the same time, emigration from this traditional immigration country is reducing output potential.

At best, we can hope that the Fed, which is increasingly influenced by politics, is right in its forecast of a one-off rise in price levels due to tariffs (or “temporary” inflation). But the experience of 2021/22 shows how wrong the Fed can be in its assessments. It massively underestimated the development of the inflation rate. We tend to believe that inflation in the US is likely to remain permanently above target in the coming years.

If, in its response to its two objectives (price stability and full employment), the Fed were to place more emphasis on the labor market and less on inflation data in the future, this could lead to greater key interest rate cuts than the market currently expects. Against the backdrop of financial conditions that are already loose by historical standards, this would certainly weaken the stability of the dollar.

Asset class 3–6 months 12–24 months Analysis
Bank account Interest rates on larger amounts have slipped back into negative territory at major banks. Even for individual customers, rates above 0.0% are likely to become the exception.
Euro / Swiss franc We expect the exchange rate against the euro to remain stable over the next 12 months. Hedging costs are likely to remain at 2.2% p.a.
US dollar / Swiss franc Goldman Sachs expects the exchange rate to fall from 0.80 to 0.74 in 12 months. All public forecasts predict a weakening.
Euro / US dollar The euro is likely to move northwards towards 1.20 rather than southwards from its current level of 1.16 against the dollar in the coming quarters.

Bonds

Significant interest rate cuts in the last two years

Central banks around the world have cut interest rates a total of 316 times in the last two years, officially surpassing the number of interest rate cuts made between 2008 and 2010 in response to the financial crisis. Financial conditions have eased significantly over the past two years from one of the most restrictive levels ever seen in monetary policy. And the outlook remains good. There are many indications that global economic momentum is likely to pick up over the next 9 to 18 months.

Read more Close
Swiss National Bank (Image source: stock.adobe.com)

Looking at global monetary policy from a different angle, it can be seen that over 90% of central banks in industrialized and emerging countries have either lowered interest rates or left them unchanged in the last six months – a level last seen during the crisis of 2020. Central banks’ interest rate policies changed at a historic pace as inflation rates melted away.

Restrictive monetary policy was abandoned in many places. This makes sense and strengthens all economic entities. As a result, global financial conditions have reached their lowest level since 2021. When central banks around the world adjust interest rates, everyone is ultimately affected: mortgage costs, bank deposit rates, corporate financing, and consumer loans all react to this. But life annuities also react to lower interest rates, for example when you reach retirement age, as do rents.

The same applies to asset prices, from stocks and bonds to real estate, currencies, and precious metals. In periods of high interest rates, future cash flows (e.g., from rental income, coupon payments, or dividends) are discounted at high rates to arrive at a present value. The higher the discount rate, the lower the present value. The steep key interest rate hikes in 2022, which occurred almost simultaneously around the world, led to significantly lower valuations at that time.

This trend is currently being reversed. In some places, it is considered complete, while in others there is still considerable potential for a surge in valuations. Where discount rates are being lowered due to the respective central bank policy, the present value of future cash flows increases.

However, in terms of the economy, the changes and revaluations are occurring with a certain delay. For example, because inflation remains relatively high in the Anglo-Saxon region (US, UK), interest rates also remain relatively high. Working capital is correspondingly expensive and the profitability hurdle for investments is higher. If monetary policy in these countries becomes significantly more expansionary over the coming years and key interest rates are lowered, significantly higher valuations (e.g. bonds with a high duration and real estate) would be expected.

Given the scale of the measures taken by central banks, it remains a constant challenge to allocate capital to where the expected future steps, taking currency risks into account, are likely to yield the highest risk-adjusted returns.

Asset sub-class 3–6 months 12–24 months Analysis
Government bonds In the US, the Fed is likely to cut key interest rates by a further 0.25% to a range of 3.50% to 3.75% at its meeting on December 10.
Corporate bonds In an environment of high corporate bond valuations, we favor a selective, disciplined approach.
High-yield, hybrid bonds Subordinated and high-yield corporate bonds (including those from the insurance and banking sectors) offer stable, attractive returns.

Zugerberg Finanz bond solutions

Positive returns are emerging

Our bond solutions are showing solid positive returns for the 2025 calendar year. As expected, the Zugerberg Income Fund (+2.1%) is yielding slightly less than the more risk-tolerant Credit Opportunities Fund (+3.4%). The Swiss Bond Index (AAA to BBB Total Return Index), which represents bonds on the Swiss franc capital market, stands at +0.9% after eleven months and has a meager yield to maturity of just 0.7%.

Read more Close
5-year government bond yields in local currency (Source: Bloomberg | Graphic: Zugerberg Finanz)

With the slightly more risk-tolerant Credit Opportunities Fund (COF), we have been deliberately operating partly in the “investment grade” area and partly in the “sub-investment grade” area for more than a decade. The current ratio is 35% to 65%, which characterizes a typical crossover portfolio where you don’t have to decide in advance which side to choose. In contrast, virtually all corporate bonds in the Zugerberg Income Fund (ZIF) are in the investment grade range.

What is interesting now is the phase that has been ongoing for two years, in which corporate bonds have shown virtually the same volatility as government bonds, but typically yield a noticeable and sometimes even significantly higher return. We remain convinced that, in the coming years, it will continue to be worthwhile, in risk-adjusted terms, to focus primarily on corporate bonds rather than government bonds in the bond segment.

However, there may be phases in which government bonds, especially in highly indebted nations, actually yield higher returns than solid, defensive bond issuers. For example, French government bonds maturing in 2032 yield slightly more than those of the French luxury goods group LVMH with the same maturity (3.0%). And in Italy, the government bond maturing in 2032 yields a comparable return to that of the Italian insurance group Generali.

We currently favor European companies with strong capital resources and are already hesitant to subscribe to bonds issued by industrial cyclicals. However, it can also happen that the company you are keeping an eye on taps other sources of financing. Companies do not always cover their capital requirements on the capital market.

For example, the Bern-based energy group BKW increased its unsecured syndicated credit line to CHF 1.5 billion with a consortium of banks. The credit facility runs until 2030 and has a one-year extension option. This secures BKW a liquidity reserve for the implementation of its “Solutions 2030” strategy, which places more emphasis on profitability than growth. BKW is in the midst of a CHF 4 billion investment phase between 2025 and 2030, which is likely to prove profitable as a result of the increasing demand for electricity from data centers. Operating activities are expected to generate more than CHF 5 billion in cash flow during the same period. Profit and dividend estimates therefore anticipate considerable growth in the coming years.

Zugerberg Income Fund Credit Opportunities Fund
Yield in 2025 (since the beginning of the year) +2.1 +3.4
Yield since the start (annualized) -5.8% (-0.8%) +38.9% (+2.5%)
Proportion of months with positive yield 57 68
Credit risk premium in basis points (vs. previous month) 93 BP (+3 BP) 412 BP (+11 BP)
Average rating (current) A BB

Real estate, infrastructure

Residential investment properties on the rise

As buying is more attractive financially than renting, the price momentum for condominiums (+4.5% within 12 months) remains intact. Prices for single-family homes (+3.2%) and in the second home market (+0.8%) have developed less strongly. The luxury market (-1.0%) even saw a decline. Purchase prices for residential investment properties (+5.3%) are also on the rise, a segment that promises pension funds and insurance companies solid cash flow returns in the long term.

Read more Close
Real estate on Limmatquai (Image source: stock.adobe.com)

From an investor’s perspective, it is interesting to see how Swiss real estate indices have performed in recent years. The REALX Swiss real estate stock index, which is calculated by the Swiss Stock Exchange, has gained an average of just 1.5% per year since January 1, 2020. However, this was not accompanied by low volatility. In fact, the index lost around 25% during the period of high inflation and sharp rises in key interest rates from March 2022 to September 2022. It took almost three years to recover from this decline (“drawdown”).

Typical Swiss real estate stocks are now trading at an average price/earnings ratio of 30, meaning that the earnings yield on an investment of CHF 100 is 3.3% and the dividend yield is 2.4%. The price/book ratio is 1.28, meaning that shares with a book value of CHF 1,573 are trading at a premium of 28% to their book value. They cost CHF 2,006. This is a hefty premium, but not excessive, as the book value tends to be associated with a certain amount of “hidden reserves” and tends to be below market value. Over the past 52 weeks, the annual low was CHF 1,670 and the high was CHF 2,006. This volatility reduces the attractiveness of an index with moderate earnings prospects.

Similar to real estate stocks, the Swiss real estate fund index SWIIT has already anticipated much of the future. The estimated premiums for real estate funds are 37% – significantly higher than for real estate stocks. Both are less attractive than direct real estate investments. However, absurd new commitments can also be seen here. When purchasing apartment buildings, institutional investors accept initial yields of up to 1.8%.

Nevertheless, SWIIT is considered relatively attractive. It is a typical benchmark for Swiss pension funds. These often invest almost blindly because the relative attractiveness is derived from the alternative of investing in safe Swiss government bonds.

However, the short remaining maturities are all in negative interest rate territory. Only the seven-year bond is just in positive territory with a yield of +0.03% (!). After that, however, the yield curve remains flat. Even 40- and 50-year bonds yield no more than 0.2% per annum. Those who chase positive Swiss franc yields with high ratings (e.g., AAA) are exposed to exceptionally high interest rate risks and thus bond price volatility risks, and will only be compensated with a minimal positive return during this period.

Asset sub-class 3–6 months 12–24 months Analysis
Residential properties CH The REALX share index (+1.5% p.a. since January 1, 2020) lags significantly behind the SWIIT real estate fund index (+5.3% p.a.). The potential for price increases is low.
Office and retail properties CH Quality remains key. Retail rents are stagnating, vacancy rates are rising, and structural change is continuing. Selection is crucial.
Real Estate Fund CH The Swiss Real Estate Fund Index (CHREF) is practically at its all-time high with high premiums: new investments are not recommended.
Infrastructure Equity / Fund Infrastructure stocks such as Engie (+52% since the beginning of the year), Vinci (+29%), and Veolia (+15%) are performing significantly better than BKW (+8%) and Zurich Airport (+13%).

Equity

Historically high concentration in the world stock index

The MSCI World global equity index comprises around 1,300 stocks. However, diversification is modest. 71% of the stocks are from US companies. The “top 10” account for around 30% of the MSCI World and ultimately all originate from the same technology sector. This level of one-sidedness is unprecedented in history and calls for caution, to say the least. We diversify our portfolios across different sectors and economic regions much better than the MSCI World.

Read more Close
The MSCI World as at 30 November 2025 ( Source: Bloomberg L.P. | Graphic: Zugerberg Finanz, red: share price lower than at the beginning of the year, green: higher than at the beginning of the year in CHF)

Typically, our equity portfolios are more diversified across sectors, with Nestlé representing the food sector and Novartis and Roche representing healthcare, for example. Holcim, Amrize, and Sika reflect the solid growth of the building materials industry, while Siemens and Schneider Electric embody industrial automation and electrification, etc.

Some sectors are temporarily very popular with investors, while others (e.g., private market investment managers such as Partners Group) are currently expressing a certain degree of skepticism about market expectations for the coming years. We consider these assessments to be far too pessimistic.

The broad market consensus among financial analysts can sometimes change rapidly and suddenly cause a massive shift in share prices. In the case of Alphabet, many analysts (contrary to our assessment) predicted an AI-related slump in Google search queries. Instead, the exact opposite has happened to date. The share price fell from USD 189 to USD 145 (-23%) in the first few months of this year, but we remained invested. Quarter after quarter, the fears were refuted. Ultimately, the price rose to USD 320 by the end of November, 69% higher than at the beginning of the year.

In general, the best currency-adjusted return opportunities in the current year were not in the US (S&P 500 up 3%), but on this side of the Atlantic. The significant performance differences between European countries to date also demonstrate the importance of disciplined selection. While the French CAC 40 index rose by only 10%, the figure was 20% in Germany (with stocks such as Siemens) and 41% in Spain (e.g., Iberdrola). It is interesting to note, however, that after the reporting season for the third quarter of 2025, numerous fair value estimates were revised upward.

Fair value estimates have recently been raised not only for Nvidia, Apple, Amazon, and Alphabet, but also for the Swiss pharmaceutical companies Novartis and Roche. From this perspective, certain communications service providers (e.g., Deutsche Telekom, which is attracting investors with a record dividend and benefiting from strong US business) and infrastructure providers remain clearly undervalued.

Siemens also continues to have potential under CEO Roland Busch. He is placing the strategic focus on accelerated, more profitable growth in digital businesses, networked and software-defined hardware, and AI applications for industry. With the acquisitions of Altair and Dotmatics, Siemens is increasingly becoming a technology company with annual growth of 6% to 9%, and investors are benefiting from this through a progressive dividend policy.

Asset sub-class 3–6 months 12–24 months Analysis
Equity Switzerland The Swiss stock market has performed extremely well over the past 11 months. With a moderate P/E ratio, performance stands at +10.6%.
Equity Eurozone, Europe Seven of the top 10 stocks in the Euro Stoxx 50 (+14.9% in CHF) are major European banks such as Banco Santander, Deutsche Bank, Unicredit, and ING.
Equity USA After 11 months, the S&P 500 (+3.0% in CHF) is ahead of the Dow Jones (-0.6%) and behind the Nasdaq technology index (+7.2%).
Equity Emerging markets The global equity index (+5.7% in CHF) did not experience any significant momentum in 2025 due to China (CSI 300 +5.2%; Hang Seng +14.0%) and India (Sensex -5.8%).

Alternative investments

Are there alternatives to the IT sector?

The weighting of the IT sector has steadily increased in recent years. Most recently, a few stocks accounted for just over 40% of the stock market. The IT sector is now the most heavily weighted sector not only in US stock indices, but also in those of emerging markets such as China, Taiwan, South Korea, etc. However, the prices already reflect a great deal of hope for the future. So what is the alternative?

Read more Close
Weighting of the IT sector in the S&P 500 Index, 1990 to 2025 (Source: Bloomberg L.P. 30 November 2025 | Graphic: Zugerberg Finanz)

The European Central Bank (ECB) Financial Stability Report summarizes that uncertainty in the capital markets is likely to persist “…with the potential for renewed spikes.” The report states that the financial markets – especially the stock markets – are vulnerable to sharp corrections due to persistently high valuations and increasing concentration. The ECB was not referring to the valuation of European equities. These have a low weighting in global comparisons and are moderately valued. Rather, the ECB recently warned of the risk of a stock market correction that could be triggered by highly valued US tech stocks and the hype surrounding artificial intelligence (AI).

You can protect yourself against this by actively structuring your portfolio with discipline. In good times, this may mean that you are not among those with the highest returns, but in bad times, you will be able to sleep better. Investing in the global stock index currently only achieves apparent diversification. It will only become real again when IT dominance is broken and the portfolio more closely reflects the reality of the resilient global economy. That is why we are turning disproportionately to sectors such as food, pharmaceuticals, insurance, infrastructure operators, and energy suppliers rather than the MSCI World. We also place value on Swiss equities in the core allocation, which massively reduces the currency volatility of our portfolios. The risk/return profile can thus be significantly improved by analyzing historical data.

Finally, quality is also an important factor. This means that the vast majority of the portfolio is focused on companies that are highly profitable, have robust balance sheets, embody pricing power with their market shares, and have convincing management. Those who focus on such fundamental factors will continue to have relatively cheaper stocks in their portfolios, which may be boring in the short term due to their stable earnings, but are lucrative in the long term.

Speculative capital chases other stocks – those where momentum currently predicts a phenomenal upswing. During the coronavirus pandemic, Zoom Communications shares were one such example. Their valuation rose to USD 175 billion in fall 2020, even though annual revenue was only USD 350 million. Now, five years later, Zoom is more established than ever in the video conferencing business. Annual revenue is around USD 5.5 billion. The valuation fell from a speculative high to a fundamentally justified level of USD 26 billion. Similar developments can be expected for AI-related companies such as Palantir, which currently dominate the MSCI World.

Asset sub-class 3–6 months 12–24 months Analysis
Commodities Crude oil prices are around 9% (USD) and 20% (CHF) lower than at the beginning of the year. This has contributed significantly to disinflation in many countries.
Gold, precious metals Gold (+42% in CHF after 11 months) is likely to see further growth in the coming 12 months, although this is expected to be lower than in 2025.
Insurance Linked Securities Insurance-related bond risks are used to a moderate extent in our portfolios in vested benefits foundations as stable pillars.
Private equity In 2026, transactions are likely to accelerate further, leading to good results for private market managers such as Partners Group.

Summary

Asset class 3–6 months 12–24 months Analysis
Macroeconomics Global economic growth forecasts have tended to be revised upward in recent weeks. The resilience shown even vis-à-vis the US surprised some analysts.
Liquidity, currencies Hopes for an interest rate cut by the Federal Reserve on December 10 have risen so significantly that the central bank can no longer deviate from this course.
Bonds With the two Zugerberg bond solutions (+2.1% and +3.4%), we are significantly above the Swiss Bond Index return (+0.9%) after 11 months.
Real estate, infrastructure Thanks to low cash flow volatility, solid returns in Swiss francs can continue to be achieved in both asset classes in the coming years.
Equities Strong earnings are supporting solid equities. Where there are fears of excessive investment (e.g., Oracle, Meta/Facebook), equities are falling.
Alternative investments Concerns about systemic problems in the private credit segment are clearly exaggerated. This means there is all the more potential for recovery.

Market data

Asset class Price (in local currency) Monthly / YTD / Annual performance (in CHF)
Equity 30.11.2025 11/2025 2025YTD 2024 2023 2022
SMI CHF 12'834.0 +4.9% +10.6% +4.2% +3.8% –16.7%
SPI CHF 17'652.9 +4.0% +14.1% +6.2% +6.1% –16.5%
DAX EUR 23'836.8 +0.1% +18.6% +20.4% +13.1% –16.3%
CAC 40 EUR 8'122.7 +0.6% +9.2% –1.0% +9.6% –13.9%
FTSE MIB EUR 43'357.0 +1.0% +25.6% +14.1% +20.4% –17.3%
FTSE 100 GBP 9'720.5 +0.7% +11.3% +12.1% –0.3% –8.8%
EuroStoxx50 EUR 5'668.2 +0.7% +14.8% +9.6% +12.1% –16.0%
Dow Jones USD 47'716.4 +0.2% –0.8% +22.1% +3.5% –7.7%
S&P 500 USD 6'849.1 +0.0% +3.0% +33.4% +13.1% –18.5%
Nasdaq Composite USD 23'365.7 –1.6% +7.0% +39.2% +30.6% –32.3%
Nikkei 225 JPY 50'253.9 –5.5% +12.4% +15.2% +8.6% –19.7%
Sensex INR 85'706.7 +1.3% –7.1% +13.8% +7.4% –4.8%
MSCI World USD 4'398.4 +0.1% +4.9% +26.6% +10.8% –18.5%
MSCI EM USD 1'366.9 –2.6% +12.4% +13.6% –2.6% –21.5%
Bonds (mixed) 30.11.2025 11/2025 2025YTD 2024 2023 2022
Glob Dev Sov (Hedged CHF) CHF 152.9 –0.3% –0.2% –1.4% +2.2% –13.2%
Glob IG Corp (Hedged CHF) CHF 188.5 +0.1% +3.0% –0.8% +4.2% –16.7%
Glob HY Corp (Hedged CHF) CHF 378.2 +0.1% +5.0% +6.1% +8.7% –13.6%
USD EM Corp (Hedged CHF) CHF 287.9 –0.1% +5.9% +2.4% +4.5% –18.2%
Government bonds 30.11.2025 11/2025 2025YTD 2024 2023 2022
SBI Dom Gov CHF 189.3 –0.6% +1.3% +4.0% +12.5% –17.0%
US Treasury (Hedged CHF) CHF 139.7 +0.3% +2.5% –3.8% –0.5% –15.0%
Eurozone Sov (Hedged CHF) CHF 178.4 –0.2% –1.0% –0.8% +4.8% –18.9%
Corporate bonds 30.11.2025 11/2025 2025YTD 2024 2023 2022
CHF IG Corp (AAA-BBB) CHF 193.2 0.0% +1.2% +5.1% +5.7% –7.5%
USD IG Corp (Hedged CHF) CHF 191.0 +0.3% +3.8% –2.4% +3.5% –18.5%
USD HY Corp (Hedged CHF) CHF 631.3 +0.2% +3.9% +3.7% +8.5% –13.7%
EUR IG Corp (Hedged CHF) CHF 169.7 –0.4% +1.1% +2.0% +5.9% –14.1%
EUR HY Corp (Hedged CHF) CHF 310.9 0.0% +2.7% +5.4% +9.8% –10.9%
Alternative investments 30.11.2025 11/2025 2025YTD 2023 2022 2021
Gold Spot CHF/kg CHF 109'583.4 +5.8% +43.1% +36.0% +0.8% +1.0%
Commodity Index USD 110.4 +2.8% –1.1% +8.3% –20.4% +15.1%
SXI SwissRealEstateFunds TR CHF 2'963.4 –0.2% +9.2% +16.0% +5.4% –17.3%
Currencies 30.11.2025 11/2025 2025YTD 2024 2023 2022
US dollar / Swiss franc CHF 0.8040 –0.1% –11.4% +7.8% –9.0% +1.3%
Euro / Swiss franc CHF 0.9322 +0.4% –0.8% +1.2% –6.1% –4.6%
100 Japanese yen / Swiss franc CHF 0.5146 –1.5% –10.7% –3.4% –15.4% –11.0%
British pound / Swiss franc CHF 1.0637 +0.5% –6.3% +6.0% –4.2% –9.3%
Back to News