Monthly Report 01/2024

Lime trees on a moraine hill near Oelegg Neuheim, Canton Zug (Photo: Andreas Busslinger)
Publications

Encouraging end to 2023

Three months ago, we pointed out in the monthly report that the final quarter is often accompanied by positive returns. This proved to be the case in an impressive way. We remained invested, which is why our portfolios benefited greatly from the recent upturn. Over the calendar year as a whole, the performance made a very good impression.

The recovery on the capital markets was evident in all asset classes. Equities certainly benefited from falling inflation rates worldwide, but so did real estate and infrastructure stocks. The recovery in bonds, which we manage on a currency-hedged basis, was also impressive. This proved to make sense in 2023, especially as the franc was the strongest G10 currency and gained 12.2% against the Bloomberg Dollar Spot Index.

In Swiss franc terms, the US equity market (S&P 500: +13.1%) gained as much as the Euro Stoxx 50 (+12.1%). The Indian Sensex 30 (+7.4%) was one of the few winners among the up-and-coming Asian emerging markets, while the indices in China (Hang Seng -21.7%), Thailand (-21.5%), Malaysia (-15.1%) and the Philippines (-10.2%) all suffered significant losses.

Swiss equities (Swiss Market Index +3.8%) performed positively. However, they lagged well behind the world equity index (MSCI All Country Index with +9.3% in Swiss francs). Around 62% of the world equity index is made up of US equities. We continue to hold the majority of our equity exposure to Swiss companies. Our selection enabled us to outperform the world equity index. This also applies to bonds. The world bond index (Bloomberg Global Aggregate), hedged in Swiss francs, was +2.5% at the end of 2023. Our bond solutions achieved an annual return of up to +6.1% (our flagship Zugerberg Income Fund).

The final quarter was positive again

On the capital markets, it is noticeable that the final quarter of a calendar year often ends with an above-average positive return. This was again the case in 2023. The month of December also proved to be particularly valuable for strategies with a high bond ratio.

In our defensive risk category 1 (e. g. Revo1 with a return of +6.5% for the year as a whole), the recovery began after the poor previous year. We expect it to continue over the next two years, particularly thanks to the expected yields on bonds. In the “balanced” risk category 3 (e. g. Revo3 with +9.9%), the total return was at a good level. Equities contributed the bulk of the return.

Dynamic risk categories 4 and 5 performed exceptionally well (e. g. Revo4 at +11.0% and Revo5 at +12.4%). The highest return in 2023 as a whole was achieved by the dividend solution, which focuses exclusively on promising equities with a handsome dividend yield (e. g. RevoDividends +15.4%).

The returns in the vested benefits solutions were unable to keep pace with those in the Revo strategies. As with Swiss pension funds, these vested benefits foundations contain unlisted vehicles that are valued at net asset value. In the case of real estate and infrastructure investments, only the income influences the result. Overall, this leads to lower fluctuations in these strategies: They are lower in good years and higher in bad years than solutions based exclusively on listed securities.

Strategies mainly based on individual titles Strategy performance*
December 2023 2023
Zugerberg Finanz R1 +2.1% +6.1%
Zugerberg Finanz R2 +2.3% +8.4%
Zugerberg Finanz R3 +2.3% +9.6%
Zugerberg Finanz R4 +2.2% +11.2%
Zugerberg Finanz R5 +1.7% +9.0%
Zugerberg Finanz RDividends +2.0% +14.4%
Zugerberg Finanz Revo1 +1.7% +6.5%
Zugerberg Finanz Revo2 +1.6% +8.7%
Zugerberg Finanz Revo3 +1.6% +9.9%
Zugerberg Finanz Revo4 +1.6% +11.0%
Zugerberg Finanz Revo5 +1.7% +12.4%
Zugerberg Finanz RevoDividends +1.7% +15.4%
Zugerberg Finanz DecarbRevo3 +2.8% –3.8%
Zugerberg Finanz DecarbRevo4 +3.4% –7.0%
Zugerberg Finanz DecarbRevo5 +4.0% –10.0%
Zugerberg Finanz Vested benefits Strategy performance*
December 2023 2023
Zugerberg Finanz Vested benefits R0.5 +1.9% +4.0%
Zugerberg Finanz Vested benefits R1 +1.5% +4.8%
Zugerberg Finanz Vested benefits R2 +1.5% +6.1%
Zugerberg Finanz Vested benefits R3 +1.9% +6.6%
Zugerberg Finanz Vested benefits R4 +1.3% +6.9%
Zugerberg Finanz 3a pension solution Strategy performance*
December 2023 2023
Zugerberg Finanz 3a Revo1 +1.7% +6.5%
Zugerberg Finanz 3a Revo2 +1.6% +8.7%
Zugerberg Finanz 3a Revo3 +1.6% +9.9%
Zugerberg Finanz 3a Revo4 +1.6% +11.0%
Zugerberg Finanz 3a Revo5 +1.7% +12.4%
Zugerberg Finanz 3a RevoDividends +1.7% +15.4%
Zugerberg Finanz 3a DecarbRevo3 +2.8% –3.8%
Zugerberg Finanz 3a DecarbRevo4 +3.4% –7.0%
Zugerberg Finanz 3a DecarbRevo5 +4.0% –10.0%
* The stated performance is net, after deduction of all running costs, excluding contract conclusion costs

Macroeconomics

Core Inflation is back at the Target

The impressive development of annualized core inflation illustrates the temporary nature of inflation. The inflation associated with the post-pandemic surge and various supply bottlenecks, which led to the most restrictive monetary policy worldwide in the last 50 years, is back on target. However, the key interest rates of the most important central banks are lagging behind this macroeconomic development. Key central bank key rates are therefore expected to be cut in the course of 2024.

Read more Close
Development of annualized core inflation in the most important economies (Source: Goldman Sachs Global Investment Research | Graphic: Zugerberg Finanz)

Global inflation continues to fall. On average across the large group of economies (the G10 countries excluding Japan and the emerging markets), which experienced a sharp and unwanted rise in prices after the corona crisis and the start of the war in Ukraine, core inflation was 2.2% on an annualized basis in the last three months and only 1.3% in November. We therefore now expect earlier and more aggressive interest rate cuts from several major central banks such as the US Federal Reserve (Fed) and the European Central Bank (ECB). The core CPI inflation y-o-y rate in the US fell to 3.9% from 4.0% in December. Core goods inflation in particular fell sharply in 2023, and the latest data reinforce the impression that goods prices are no longer contributing to overall inflation.

The shift in monetary policy expectations was particularly abrupt in the US. At the Fed Open Market Committee’s press conference on December 13, Chairman Jay Powell stated that the FOMC wanted to cut interest rates “well before” inflation falls to 2% year-on-year. Because the Fed’s policy is an “average” inflation target of 2%, the target range is roughly from 1.5% to 2.5%. If we interpret the upper threshold of the inflation target at around 2.5%, we can expect key interest rate cuts in the US soon, as we expect inflation to fall further.

Powell’s statement does not differ significantly from forecasts made at previous meetings. However, it was made against the backdrop of the consumer and producer price data published in November, both of which indicate that core inflation is likely to reach the 2.5% threshold as early as February 2024 before falling further to around 2% in late spring. Based on recent developments, this can be forecast relatively well and accurately. As the outcome for February will be largely predictable based on the consumer and producer price data published in mid-March, we believe that the first rate cut of 0.25% is likely (70% probability) to be decided at the meeting on March 20 and 21.

If the Fed were to make further cuts of 0.25% in the May and June meetings, the key interest rates of 4.5% to 4.75% would still be a high 200 basis points above the Fed’s own assessment of a longer-term neutral key interest rate, provided that core inflation hovers around 2% on a sustained basis. Because the inflation outlook is so promising, we remain optimistic with our interest rate forecasts for the coming quarters. This is because these interest rate cuts are far from being priced into the prices of bonds with a high duration and equities and should please the capital markets in the next six months.

Region 3–6 months 12–24 months Analysis
Switzerland For Switzerland, the KOF forecasts an increase in GDP adjusted for sporting events of +1.3% in 2024, which will increase by the end of the forecast period in 2025.
Eurozone, Europe The European Labor Market Barometer rose for the first time in seven months in December 2023 (+0.2 to 99.2 points). The worst seems to be over.
USA It took nerves of steel to benefit from the strong upward movements in US equities. The first interest rate cuts will now follow and support the equity story.
Rest of the world The weaker dollar is helping to create a disinflationary trend in the remaining parte of the world and will probably ensure an above-average growth phase.

Liquidity, currency

The Swiss franc as a strong currency

The exchange rate development of the Swiss franc investor was characterized by constant devaluations. The dollar has depreciated by 80% over the last 50 years. In the case of the British pound, it was even 90%. Hedging against dollar depreciation currently costs Swiss franc investors 3.8% a year. The constant devaluations can largely be explained by inflation differences. Because the inflation rate in Germany and the eurozone was lower than in the US, the euro depreciated less.

Read more Close
FX Developments in the last 50 Years (Source: Bloomberg Finance LPs | Graphic: Zugerberg Finanz)

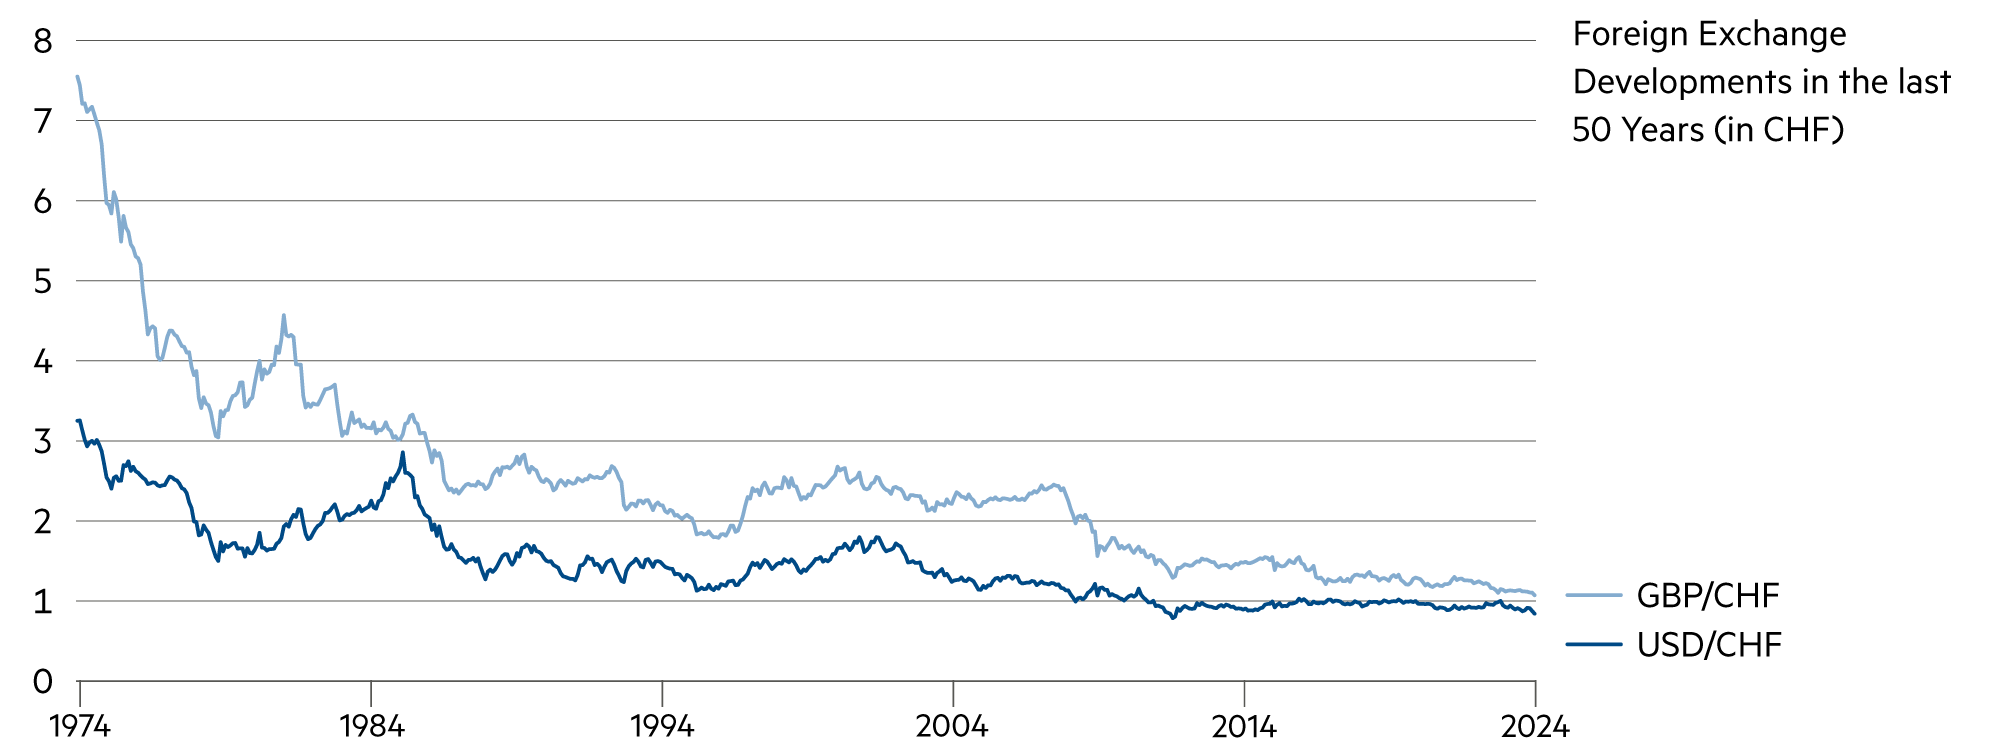
The Swiss franc was the strongest G10 currency last year, appreciating by around 12.2% against the Bloomberg Dollar Spot Index. However, 2023 is by no means an isolated case, but a very typical year for our small economy with the world’s strongest currency. Because other countries have systematic government budget and current account deficits, which are often accompanied by higher inflation rates, currencies such as the US dollar, the pound sterling and the Chinese renminbi are tending to depreciate against the franc. For investors, these are highly volatile cornerstones of a long-term investment strategy.

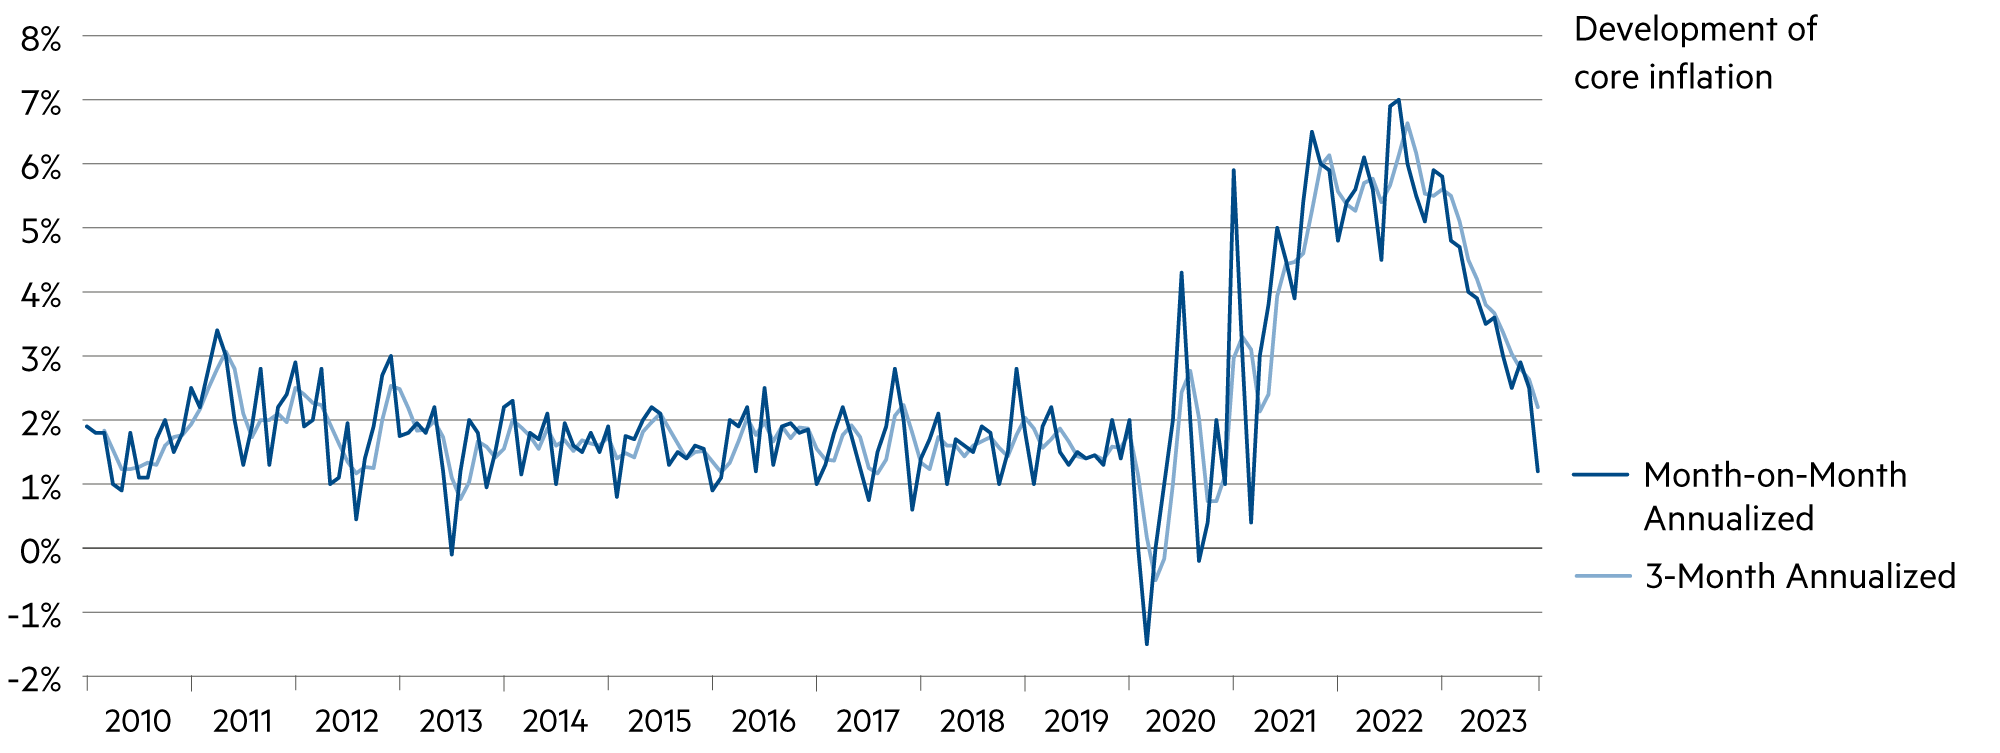
In Switzerland, not only politics but also the budget situation is balanced. Monetary and fiscal policy is geared towards stability. The democratically enshrined debt brake is proving to be effective, whereas in Germany, for example, it is not even understood by the government itself. In economic terms, Switzerland regularly achieves trade surpluses. Price stability is so firmly anchored that deflation has repeatedly occurred in recent years. Half of the last 14 years have seen slight deflation: 2009 (-0.5%), 2012 (-0.7%), 2013 (-0.2%), 2014 (-0.01%), 2015 (-1.1%), 2016 (-0.4%) and 2020 (-0.7%). Inflation in 2023 (+1.7% in December compared with the same month of the previous year) is considered relatively high by Swiss standards. The increase in 2023 was due in particular to higher prices for electricity, gas and for housing rentals. In contrast, prices for petroleum products, combined offers for fixed-line and mobile communication and medicines decreased.

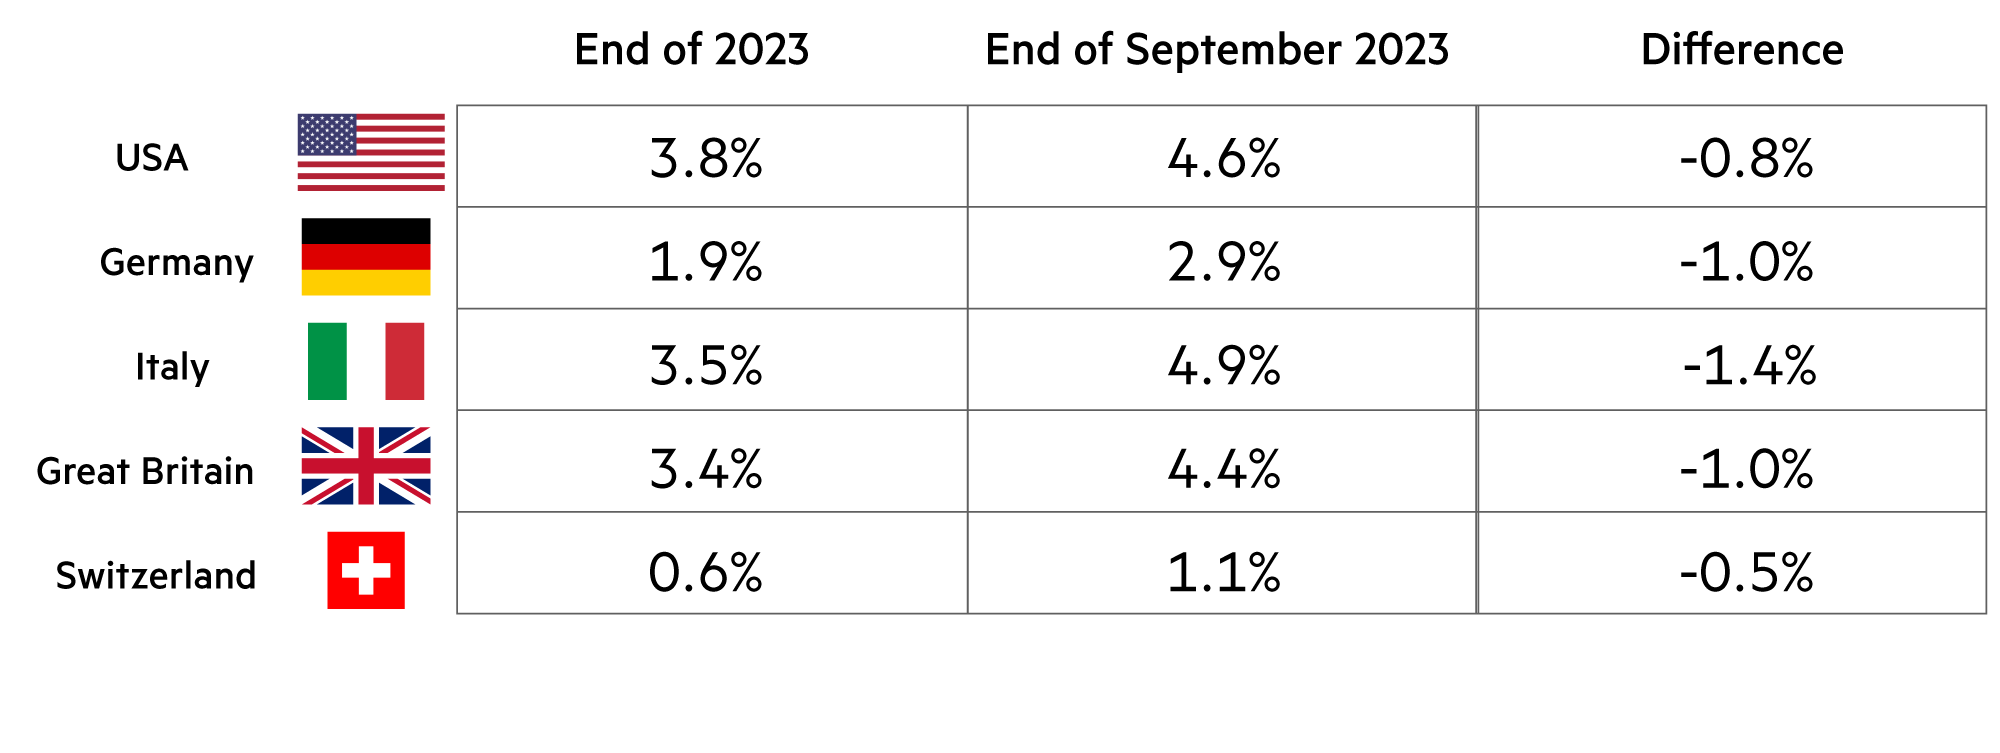
Due to the overall moderate long-term inflation path, the Swiss Confederation can offer long-term capital at favorable conditions. Switzerland remains a haven of stability and solidity. This is why bond investors receive a yield of just 0.6% on ten-year Swiss bonds at the end of the year. In early January 2024, yields have increased some 20 basis points on average and moved the benchmark yield upwards to 0.8%.

Abroad, comparable government bonds offer much higher yields (January 11, 2024): 4.0% in the US, 4.1% in Australia, 3.8% in Italy, 3.8% in the UK, 3.3% in Greece and 2.2% in Germany. However, we advise against investing in such bonds in general, as there is not much left after the cost of currency hedging.

Asset class 3–6 months 12–24 months Analysis
Bank account Anyone seeking long-term returns above the inflation rate in Switzerland (+1.4%) should invest surplus liquidity in a securities portfolio.
Euro / Swiss franc At 0.93, the FX rate has realistic upside potential in the current year – even though inflation expectations are more firmly anchored in Switzerland than in the Eurozone.
US dollar / Swiss franc Depending on the method of calculation, purchasing power parity is still around 10% lower than the current level of 0.84. The dollar still has downside potential.
Euro / US dollar The euro is 25 years old. Contrary to popular belief, the euro's exchange rate of 1.11 is almost at the same level as at the beginning of January 1999.

Bonds

Sharp decline in yields in the 4th quarter of 2023

The decline in yields on ten-year government bonds was particularly sharp in the fourth quarter of 2023. In many countries, it amounted to 100 basis points or more (with a reversal of up to 20 basis points in early January 2024). Only in Switzerland was the decline moderate. However, the low level of 0.6% has a positive impact on equity valuations, corporate bonds and real estate markets, which have not yet been sufficiently appreciated by the capital markets.

Read more Close
Government bond yields in 4Q23 (Source: Bloomberg Finance LP | Graphic: Zugerberg Finanz)

Inflation in the US fell to 3.1%, while in the eurozone it recently dropped to 2.4%. It is therefore highly likely that there will be several central bank key interest rate cuts this year. The bond markets have already anticipated some of these in the fourth quarter of 2023. After the rally in Swiss Confederation bonds, it is likely to be difficult to achieve a better performance than the coupon yield this year through passive behavior.

More significant, however, is the fact that the risk-free long-term interest rate has fallen to 0.6%. This is the benchmark when it comes to trade-offs between risk-free and risky investments.

Anyone seeking a balance between risk and return will have to consider whether they are satisfied with the expected yield premium they receive on equities or real estate, for example, compared to a risk-free Swiss Confederation bond – and whether this is also the case after taking into account the presumably higher susceptibility to fluctuation.

We exclude the historically special period from December 2020 to June 2022. During this period of sharp interest rate hikes by the Swiss National Bank, the Swiss Confederation bond index total return was miserable: -20.1% (!).

If the Swiss market portfolio is made up of SMI shares today, this results in an expected return of 6.7%; an amazing 6.1% more than with risk-free bonds. The 6.1% is also a risk premium because the investor is likely to experience fluctuations in this portfolio – with the exception of the period from 2020 to 2022 – which are generally higher than those in a portfolio consisting exclusively of government bonds.

The security of the market portfolio can also be enhanced by adding real estate at the expense of the equity allocation. However, this also reduces the return prospects somewhat, but the fluctuations in income are lower due to the stable rental income. At around 2.4%, the net cash flow return on average Swiss real estate investments is higher than the return on Swiss equities, but significantly lower than that of equities.

On the other hand, real estate investments are legally protected against inflation, which creates the potential for rents to rise over a longer period, whereas bonds as nominal values are unlikely to outperform the inflation rate in the coming years.

The Capital Asset Pricing Model, which is based on the modern portfolio theory of Harry Markowitz, the Nobel Prize winner who died in June 2023, essentially contains the investment recommendation of diversification: you should not put all your eggs in one basket.

The CAPM shows how the expected return can be increased for a given risk or how the risk can be reduced for a given expected return. Of course, even today, after almost 60 years since the CAPM was developed, we still incorporate such ideas into our actions.

Asset sub-class 3–6 months 12–24 months Analysis
Government bonds In the current economic phase, (currency-hedged) long-term USD and EUR government bonds continue to appear more attractive to us than CHF government bonds.
Corporate bonds We continue to see price recovery potential in the area of longer maturities with fixed coupons. We are pursuing this segment with a high credit rating.
High-yield, hybrid bonds The hybrid bond market is likely to become the most attractive bond segment in 2024. The recovery potential remains considerable.

Zugerberg Finanz bond solutions

Good year-end

Over the whole of 2023, the steps we took in the Zugerberg Income Fund (ZIF) and the Credit Opportunities Fund (COF) paid off. While the global aggregate bond index, which is dominated by government bonds and hedged in Swiss francs, gained 2.5% in 2023, the ZIF achieved a significantly higher return of +6.1%. The COF rose less strongly (+4.5%).

Read more Close
Bond Solutions in a 5 Year Comparison (Graphic: Zugerberg Finanz)

Most large Swiss investors use the global bond index (“Global Aggregate Total Return Index Hedged CHF”), hedged in Swiss francs, as a benchmark for their bonds. This has enabled them to achieve a net return of -6.0% over the past five years. This is exactly the same as the five-year return of the Zugerberg Income Fund. Converted to a single year, this results in an annual return of -1.2%. However, the same return should not obscure the fact that the path to this result was different.

The global bond index is dominated by government bonds, which proved to be more stable in value, especially in March 2020 (explosion of the global coronavirus pandemic). By mid-June 2021, however, the Zugerberg Income Fund had made up for this difference. Following the outbreak of war in Ukraine, the ZIF fell more sharply than the World Bond Index. Once again, it took around five quarters before the difference was made up again.

The ZIF always has a good quality rating. It currently has an A- rating. With its high proportion of government bonds, the World Bond Index has greater value stability in crises, but also loses attractiveness when the global economy stabilizes.

The ZIF is characterized by higher credit risk premiums compared to the corresponding government bonds. Companies are eliminated through active trading if financing difficulties become apparent. Over the past five years, there have been around 1’000 transactions in the ZIF.

The Swiss Bond Index is an exotic index worldwide because it is extremely small and hardly diversified. It is essentially dominated by Swiss bonds. This helped it to (unsustainably) outperform the global bond index in the second half of 2023. Overall, however, the return over the past five years was still a meagre -3.7% (-0.74% annually). Moreover, the recovery potential in the Swiss Bond Index appears to be virtually exhausted, while it remains intact in the Zugerberg Income Fund.

The five-year balance sheet for the Credit Opportunities Fund looks positive with a return of +5.4% (+1.1% annually) – despite the pandemic, war, inflation, a persistent negative and zero interest rate phase and sometimes extreme financing difficulties for real estate and retail companies. Overall, the patience to remain invested has paid off. The recovery potential continues.

Over the next two years, it will be a matter of carefully managing the portfolio above the previous high. Since the bond fund was launched around eleven years ago, it has generated a positive return of +2.0% per year. It has been awarded the highest rating (five stars) by the fund rating agency Morningstar for its long-term outperformance.

Zugerberg Income Fund Credit Opportunities Fund
Yield in 2023 (since the beginning of the year) +6.1% +4.5%
Yield since the start (annualized) -8.4% (-1.6%) +25.2% (+2.0%)
Proportion of months with positive yield 53% 66%
Credit risk premium in basis points (vs. previous month) 133 BP (-17 BP) 557 BP (-99 BP)
Average rating (current) A- BB+

Real estate, infrastructure

Lower interest rates as a key factor

Last year, the return on our real estate and infrastructure stocks of +19.4% exceeded that of equities at +17.8%. This was a surprise, as stable-income stocks rarely generate such overall returns. Two factors favored this development: on the one hand, numerous infrastructure stocks such as Zurich Airport were still in their post-pandemic recovery phase. On the other hand, lower long-term interest rates resulted in higher valuations.

Read more Close
Swiss Franc Swap Index (Source: Bloomberg CHF SARON Swap Spread Kurve | Graphic: Zugerberg Finanz)

A year ago, the mood was gloomy for property owners. The entire real estate sector was concerned about “fair” market prices in an environment of inflation-driven interest rate hikes. Financing costs rose in line with the SNB prime rate. SARON-based mortgages soon cost 2.5%. Real estate appraisers often applied even higher rates.

The valuations of properties fell accordingly, whereby the price effect was greater for residential properties than for commercial properties. The higher sensitivity of residential properties can be derived from the higher duration. The duration is lower for commercial properties. Typical characteristics such as fixed contract durations (e. g. 5 years) or higher inflation indexation for commercial leases reduce price sensitivity.

Now, with falling inflation rates and the prospect of lower borrowing costs, the picture has fundamentally changed. Swiss franc swap rates fell massively in the fourth quarter. In the 4-year segment, the swap rate fell from 1.70% to 1.07% (-62 basis points), while in the 10-year segment the decline was even more pronounced from 1.83% to 1.19% (-64 basis points). The change was most noticeable in the very long-term segment, where swap rates fell from 1.89% to 1.21% (-68 basis points) in the 20-year segment and from 1.83% to 1.14% (-69 basis points) in the 30-year segment.

The swap rates serve as the benchmark for lending banks, insurance companies and pension funds. For a typical mortgage loan, a customer-specific margin of around 0.8% can be added. This means that longer-term mortgage loans can once again be fixed somewhere around 2%. This level is having a strong stabilizing effect on the the Swiss real estate sector. It has an impact on various real estate submarkets that could hardly have been dreamed of this new environment just a few months ago. Swap-based mortgages have become a lot cheaper than SARON-based ones.

It is now clear that the residential property market will brighten up. The reluctance of potential homeowners, which was understandable in 2023 in view of increased inflation and mortgage interest rates, will subside in the coming months. The typical spring real estate fairs are likely to see brisk transactions again. The recovery in the market values of apartment buildings is also foreseeable. On the one hand, vacancy rates will continue to fall in 2024, and on the other, according to real estate expert FPRE, “the high demand in many regions should ensure an increase in achievable market rents”.

We also see further potential in our infrastructure investments. Lower long-term interest rates ensure lower capital costs and therefore higher cash flows. In addition, there are various performance improvements such as more passengers, higher retail volumes and higher rental income for Zurich Airport. This should lead to a higher valuation.

Asset sub-class 3–6 months 12–24 months Analysis
Residential properties CH Fixed-rate mortgages in the 3 to 5 year range have become much more attractive and cheaper than SARON mortgages. Swap rates fell to 1.07% (1.70% as at 30.9.).
Office and retail properties CH In view of the low long-term interest rates, high-quality real estate investments in Switzerland and abroad are once again attracting increased investor interest.
Real Estate Fund CH In 2024/25, the application of lower discount rates is likely to lead to appreciation and higher premiums - especially for top-quality properties.
Infrastructure Equity / Fund Infrastructure performance in 2023 contributed 1.0% to the total return in the balanced portfolio R3. The weighting was 4.8% and the return was +19.4%.

Equity

Lower interest rates lead to higher valuations

We are observing a hesitant attitude towards equities in many places. Many professional players still seem to be assuming structurally high interest rates and higher inflation rates. However, we believe that the return to lower interest rates is not just temporary, but permanent. Accordingly, we assume that Swiss equities in particular will see higher valuations.

Read more Close

We previously looked at the low risk-free interest rates and the high probability that interest rates will remain low. This is probably the most important factor that will support the stock market.

To illustrate this idea, let’s look at an example. We find a company that generates reliable, robust profits due to its market position. We are not assuming an increase in profits. But of course we would be happy to see the current share price or company value on the capital markets as high as possible because we are already invested.

Future earnings can be discounted using the “discount” factor, i. e. the time value of money is taken into account using the risk-free interest rate. A risk premium is added as compensation for the systematic risk, but to illustrate the effect of lower Swiss Confederation yields on share price valuations, we exclude the risk component.

If a company makes a profit of CHF 10 per year over the next 30 years, the present value of the company, i.e. the present value (PV) of all future profits, is calculated as follows using a discount factor of 3.0%:

With a discount factor corresponding to the yield on the long-term Swiss franc (0.6%), the same calculation method produces a present value of 273, which is 39% more.

From this it can be learned that the interest rate used to discount future income is of paramount importance in the calculation of the present value. What you also need to know: Most professional players are currently still assuming structurally increased inflation rates and interest rates. They are reluctant to adjust their models and may therefore miss out on the current trend of real assets appreciating as interest rates fall.

Whether we use the “right” interest rates or not is not the decisive factor here. What is important is that the lower the discount factor, the higher the present value. This factor is strengthened if we can assume rising valuations in the near future.

In the case of a market-leading company, it can be assumed that it should be possible to increase profits sustainably in the coming years due to organic and acquisition-driven growth impulses with simultaneous productivity improvements and lower financing costs. Such companies (e. g. Nestlé, Sika, Schneider Electric, etc.) enjoy a firm place in our portfolios.

Asset sub-class 3–6 months 12–24 months Analysis
Equity Switzerland Compared to the risk-free investment of 0.6%, we find the risk premium obtained on the equity market attractive. We are sticking to our selective approach.
Equity Eurozone, Europe An unusually large number of European equities remain attractively valued in view of the promising growth and cash flow prospects.
Equity USA In the USA, there are a number of AI-oriented companies that we are holding in our portfolio because we want to benefit from this secular change.
Equity Emerging markets As the dollar weakens, emerging market assets become more attractive. However, we would not invest in autocratically governed countries.

Alternative investments

Listed private equity as valuable diversification

Last year, our diversification in the listed private equity sector enabled us to outperform the Swiss Market Index by around 20%. Most of this was achieved in the last two months, when one thing became pretty clear: The global trend towards persistently lower inflation rates and significantly better financing conditions began to emerge.

Read more Close
Swiss Market Index vs. Listed Private Equity in 2023 (Source: Bloomberg Finance | Graphic: Zugerberg Finanz)

Over the past ten years, listed private equity has outperformed the equity markets by more than 70%. This corresponds to an annual excess return of around 6% compared to listed companies. However, you also need to have a higher appetite for volatility and risk in order to use such vehicles in a portfolio.

There is no possibility of using listed private equity in our risk category 1. We have excluded this because we want to use particularly low-risk securities and try to keep the volatility of the corresponding portfolio as low as possible.

As our risk appetite increases, so does the corresponding use of “alternative investments” in our portfolio strategy. In the balanced strategy R3, the weighting is 6%. Some may say it is “only” 6%, while others consider this to be a substantial figure.

In any case, depending on the risk classification, the corresponding portfolio weighting has led to an outperformance of up to one percentage point compared to an allocation to Swiss equities in 2023.

The diversification effect should also not be underestimated. This results from the fact that more and more companies have decided not to be listed on the public markets.

In terms of content, our Listed Private Equity portfolio component is essentially broadly diversified through a fund, as we reported last month. This includes around 30 private market investment companies, which in turn hold at least ten companies on their balance sheets. The fund is thus based on an estimated 500 portfolio companies.

They are selected and promoted in their growth by well-known investment companies such as the Canadian Onex (which brought the successful SIG Group to the Swiss stock exchange), the British HgCapital (which has several outstanding IT companies for the European SME market) and the American KKR (which is world-famous for its excellent private market portfolio).

This broad diversification across a wide range of sectors and geographical markets makes this portfolio component very robust. However, because these are structurally smaller and medium-sized companies with a certain amount of debt capital, interest rate sensitivity remains significantly higher than in the case of cash-generating US companies such as Apple and Microsoft.

The prospects for listed private equity in the current year have improved significantly due to the trend towards lower interest rates. In addition, the IPO window has reopened and M&A transactions are likely to increase again.

Asset sub-class 3–6 months 12–24 months Analysis
Commodities At -12% (in dollars), -15% (in euros) and -20% (in CHF), the global commodity index fell significantly last year and contributed to disinflation.
Gold, precious metals At CHF 1’732 per ounce, the gold price was a meagre 2.6% higher than at the start of the year.
Insurance Linked Securities The niche market for ILS and subordinated insurance bonds will remain attractive in 2024, supported by a relatively low volume.
Private equity Our selection of “Listed Private Equity” in our customer’s portfolio should also outperform in 2024. The general conditions are excellent.

Summary

Asset class 3–6 months 12–24 months Analysis
Macroeconomics The global economy is expected to grow by just under 3% in real terms in 2024. The best prospects are in India (GDP: +7%) and the South East Asia Pacific economic region.
Liquidity, currencies After a steep rise in central bank rates until well into 2023, the question this year is when and how much they will be lowered.
Bonds A negative interest rate shock has been blowing around the bond markets for three months. Yields on the most important 10y government bonds fell by at least 1.0%.
Real estate, infrastructure Infrastructure proved to be an exceptionally attractive investment in 2023, as it generates inflation-proof returns. Lower interest rates will be added in 2024.
Equities The price earnings ratio (PER) remains attractive. An average Swiss share should generate an earnings yield of more than 6% (2024).
Alternative investments Important additions to equities and bonds are needed to truly diversify a mixed securities portfolio in real economic terms.

Market data

Asset class Price (in local currency) Monthly / YTD / Annual performance (in CHF)
Equity 31.12.2023 12/2023 2023 2022 2021 2020
SMI CHF 11'137.8 +2.6% +3.8% –16.7% +20.3% +0.8%
SPI CHF 14'571.2 +2.4% +6.1% –16.5% +23.4% +3.8%
DAX EUR 16'751.6 +0.7% +13.1% –16.3% +10.4% +3.5%
CAC 40 EUR 7'543.2 +0.6% +9.6% –13.9% +23.6% –7.4%
FTSE MIB EUR 30'351.6 –0.5% +20.4% –17.3% +17.3% –5.4%
FTSE 100 GBP 7'733.2 +0.6% –0.3% –8.8% +16.7% –19.2%
EuroStoxx50 EUR 4'521.7 +0.5% +12.1% –16.0% +16.0% –5.4%
Dow Jones USD 37'689.5 +0.6% +3.5% –7.7% +22.2% –1.8%
S&P 500 USD 4'769.8 +0.2% +13.1% –18.5% +30.6% +6.5%
Nasdaq Composite USD 15'011.4 +1.2% +30.6% –32.3% +25.0% +31.6%
Nikkei 225 JPY 33'464.2 +0.9% +8.6% –19.7% –2.6% +11.6%
Sensex INR 72'240.3 +3.7% +7.4% –4.8% +23.2% +3.4%
MSCI World USD 3'169.2 +0.5% +10.8% –18.5% +23.7% +4.5%
MSCI EM USD 1'023.7 –0.5% –2.6% –21.5% –1.8% +6.1%
Bonds (mixed) 31.12.2023 12/2023 2023 2022 2021 2020
Glob Dev Sov (Hedged CHF) CHF 155.4 +2.5% +2.2% –13.2% –3.0% +3.5%
Glob IG Corp (Hedged CHF) CHF 184.4 +3.4% +4.2% –16.7% –2.0% +6.4%
Glob HY Corp (Hedged CHF) CHF 339.5 +3.4% +8.7% –13.6% +1.4% +3.7%
USD EM Corp (Hedged CHF) CHF 265.6 +3.7% +4.5% –18.2% –2.7% +4.3%
Government bonds 31.12.2023 12/2023 2023 2022 2021 2020
SBI Dom Gov CHF 179.5 +2.3% +12.5% –17.0% –4.2% +2.1%
US Treasury (Hedged CHF) CHF 141.7 +2.9% –0.5% –15.0% –3.5% +6.3%
Eurozone Sov (Hedged CHF) CHF 181.6 +3.4% +4.8% –18.9% –3.7% +4.6%
Corporate bonds 31.12.2023 12/2023 2023 2022 2021 2020
CHF IG Corp (AAA-BBB) CHF 181.7 +0.9% +5.7% –7.5% –0.5% +0.5%
USD IG Corp (Hedged CHF) CHF 188.5 +3.9% +3.5% –18.5% –2.3% +8.0%
USD HY Corp (Hedged CHF) CHF 586.4 +3.3% +8.5% –13.7% +4.1% +5.1%
EUR IG Corp (Hedged CHF) CHF 164.6 +2.5% +5.9% –14.1% –1.2% +2.4%
EUR HY Corp (Hedged CHF) CHF 287.1 +2.6% +9.8% –10.9% +3.2% +2.1%
Alternative investments 31.12.2023 12/2023 2023 2022 2021 2020
Gold Spot CHF/kg CHF 55'805.8 –2.6% +0.8% +1.0% –0.6% +14.6%
Commodity Index USD 98.6 –7.1% –20.4% +15.1% +30.8% –11.6%
SXI SwissRealEstateFunds TR CHF 2'339.8 +5.8% +5.4% –17.3% +7.6% +13.0%
Currencies 31.12.2023 12/2023 2023 2022 2021 2020
US dollar / Swiss franc CHF 0.8414 –3.9% –9.0% +1.3% +3.1% –8.4%
Euro / Swiss franc CHF 0.9289 –2.5% –6.1% –4.6% –4.0% –0.4%
100 Japanese yen / Swiss franc CHF 0.5965 +1.7% –15.4% –11.0% –7.5% –3.8%
British pound / Swiss franc CHF 1.0716 –3.0% –4.2% –9.3% +1.9% –5.7%
Back to News