Monthly Report 02/2024

Bruedermettli, Unterägeri, Canton Zug (Photo: Andreas Busslinger)
Publications

Solid start into the new year

The new year got off to a good start. The majority of economic signals remained positive. Even at the beginning of February. While the comments from Federal Reserve Chair Jerome Powell largely mirrored his comments from the January press conference, the interviewer reported that Powell “suggested to us the likely time for the first interest rate cut would be the middle of the year, a few months before the election.”

Corporate news was surprisingly positive for the most part. This caused the Swiss Market Index (SMI) to rise by 1.8% in January. Certain companies disappointed. Even small negative surprises were punished heavily here and there, for example at the construction chemicals group Sika (-12% since the beginning of the year).

In some places, however, the last quarter was convincing, in others the outlook for the coming quarters. Several companies confirmed their ambitious medium-term guidance. The latter mainly concerned shares that have already had to accept harsh criticism for short-term fluctuations in recent years. However, Lonza (+20% in January), SAP (+15%) and SGS (+10%) are all in an upswing period lasting several years and accompanied by considerable investments. It can therefore happen that not every quarterly result is equally pleasing.

The strategic path seems more important to us. This also applies to the building materials group Holcim, which will be split into a “North American Holcim” (it will get a new brand) and the traditionally known Holcim for the rest of the world in the coming year. The Zug-based headquarters will also have to be split up in line with the spin-off. This will create a great deal of potential for shareholders, as recent experience shows that companies listed in North America trade at around 25% higher prices than their European peers.

Things picked up in January

In January, the equity-related Swiss Market Index (SMI) rose to 11’333 points (+1.8% compared with the start of the year). This was an above-average start to the year if the last five years are taken as a reference, and it was a stronger increase than in the global MSCI World (+1.2%).

The picture for real estate was mixed: Swiss real estate funds were clearly up (+2.2%), but Swiss real estate equities suffered slight losses (-1.4%). The bond-related Swiss Bond Index (AAA to BBB total return) slipped slightly by -0.6%. The world bond index – hedged in Swiss francs – also fell (-0.5%). The euro rose minimally in January (+0.2%); the reaction of the dollar to the severe losses in the previous year was at least clearly positive (+2.5% in January 2024).

In the defensive risk class 1 (e.g. Revo1 with a return of -0.3% for January), the weighting of slightly negative-yielding bonds predominated. In the “balanced” risk class 3 (e.g. Revo3 with +0.9% and R3 with +0.9%), the total return was clearly in the positive zone, which is attributable to the contribution of equities.

The dynamic risk classes 4 and 5 had an exceptionally good start (e.g. Revo4 with +1.5% and Revo5 with +1.7%). The dividend strategy’s return of +1.2% was also at this level.

Strategies mainly based on individual titles Strategy performance*
January 2024 2024
Zugerberg Finanz R1 –0.1% –0.1%
Zugerberg Finanz R2 +0.5% +0.5%
Zugerberg Finanz R3 +1.0% +1.0%
Zugerberg Finanz R4 +0.9% +0.9%
Zugerberg Finanz R5 +0.9% +0.9%
Zugerberg Finanz RDividends +1.3% +1.3%
Zugerberg Finanz Revo1 –0.1% –0.1%
Zugerberg Finanz Revo2 +0.4% +0.4%
Zugerberg Finanz Revo3 +0.7% +0.7%
Zugerberg Finanz Revo4 +1.2% +1.2%
Zugerberg Finanz Revo5 +1.4% +1.4%
Zugerberg Finanz RevoDividends +1.3% +1.3%
Zugerberg Finanz DecarbRevo3 –2.8% –2.8%
Zugerberg Finanz DecarbRevo4 –4.4% –4.4%
Zugerberg Finanz DecarbRevo5 –5.9% –5.9%
Zugerberg Finanz Vested benefits Strategy performance*
January 2024 2024
Zugerberg Finanz Vested benefits R0.5 –0.3% –0.3%
Zugerberg Finanz Vested benefits R1 +0.2% +0.2%
Zugerberg Finanz Vested benefits R2 +0.5% +0.5%
Zugerberg Finanz Vested benefits R3 +0.9% +0.9%
Zugerberg Finanz Vested benefits R4 +0.7% +0.7%
Zugerberg Finanz 3a pension solution Strategy performance*
January 2024 2024
Zugerberg Finanz 3a Revo1 –0.1% –0.1%
Zugerberg Finanz 3a Revo2 +0.4% +0.4%
Zugerberg Finanz 3a Revo3 +0.7% +0.7%
Zugerberg Finanz 3a Revo4 +1.2% +1.2%
Zugerberg Finanz 3a Revo5 +1.4% +1.4%
Zugerberg Finanz 3a RevoDividends +1.3% +1.3%
Zugerberg Finanz 3a DecarbRevo3 –2.8% –2.8%
Zugerberg Finanz 3a DecarbRevo4 –4.4% –4.4%
Zugerberg Finanz 3a DecarbRevo5 –5.9% –5.9%
* The stated performance is net, after deduction of all running costs, excluding contract conclusion costs

Macroeconomics

Global economic upside risks

Anyone taking note of the latest indicators will notice a certain upside risk: growth expectations could continue to surprise on the upside. In the developed countries, the purchasing managers’ indices rose to 50.6 (+0.9) in January, clearly indicating an accelerating economy. At the same time, inflation forecasts for 2024 were lowered in many places, which goes hand in hand with stronger real economic growth. All those who were already expecting a recession in the first quarter – at least in the US – were completely unprepared for this.

Read more Close
Core PCE inflation is back at the target (Source: Bloomberg Finance LPs | Graphic: Zugerberg Finanz)

The global economy continues to be driven by growth in Asia. India in particular is growing like no other G-20 economy. However, the latest economic impetus in North America and Europe, both in Central and Eastern Europe and in the peripheral countries, is also surprisingly positive. Real gross domestic product (GDP) in the US rose by 3.3% on an annualized basis in the fourth quarter, well above the consensus figures, with a surprisingly low inflation rate of 1.7%. The strong momentum in consumer demand until the end of 2023 suggests that GDP growth will remain solid in the first quarter, even if a slowdown in inventory investment is likely to slow growth.

The purchasing managers’ indices, as economic harbingers, also moved upwards in the eurozone in January. The values in the manufacturing sector were surprisingly positive. The index rose to 46.6 (+2.2). The index value including the service sector rose to 47.9 (+0.3) in the eurozone in January. In all countries, the improvement was driven by the periphery. The overall PMI for the UK improved again to 52.5 (+0.3), driven by a continued improvement in services activity. Supply chain related manufacturing PMI components deteriorated (possibly due to shipping disruptions in the Red Sea), but current and expected manufacturing output PMIs nonetheless rose in January.

This suggests that economic growth is likely to pick up in the coming months, albeit only moderately and certainly not inflationary as in the early post-pandemic dynamics. Despite the economic concerns, the European Central Bank (ECB) announced at its meeting on January 25 that an interest rate cut was not imminent. The deposit rate, which is decisive on the financial market and which financial institutions receive from the central bank for parking surplus funds, therefore remains at a record level of 4%. As the inflation rate has practically slipped back into the target region of snb, it is difficult to understand why the highly restrictive monetary policy should be maintained for much longer and the economy kept in a monetary stranglehold. At the World Economic Forum in Davos, President Christine Lagarde echoed the words of many of her colleagues that a reduction is “likely” (only) in the summer.

The Chinese central bank is taking a more cunning approach. In view of the bumpy economic recovery and the deflationary trend in producer and consumer prices, it has slashed the reserve ratio for commercial banks, thereby releasing liquidity for the financial and economic system. When deflationary times threaten, a restrictive monetary policy is wrong. An expansionary monetary policy is needed to counteract this.

Region 3–6 months 12–24 months Analysis
Switzerland On March 21, the SNB will hold its monetary policy assessment. It would come as no surprise if the key interest rate were to be lowered by 0.25% to 1.5%.
Eurozone, Europe For the eurozone, we expect real GDP growth of +1.0% (2024), which can be explained by an upturn in real disposable income.
USA The probability of the US entering a recession in the next 12 months remains at a very low level. Real GDP growth surprises continously in 1Q24
Rest of the world There is a very strong consensus regarding real growth momentum in India (+7% in the current year), which is clearly above average even in growing Asia-Pacific.

Liquidity, currency

China is not an attractive investment country

We continue to steer liquidity into solid values in all portfolios. We have given China a wide berth for years. A distinction must always be made between macroeconomic development at country level and the business model-related level of a company. The last three years have undoubtedly been a difficult and frustrating time for investors and market participants in Chinese equities, as this has been associated with a 58% decline in share prices.

Read more Close
MSCI India vs. MSCI China – the last 3 years in Swiss francs, (Source: Bloomberg Finance LPs | Graphic: Zugerberg Finanz)

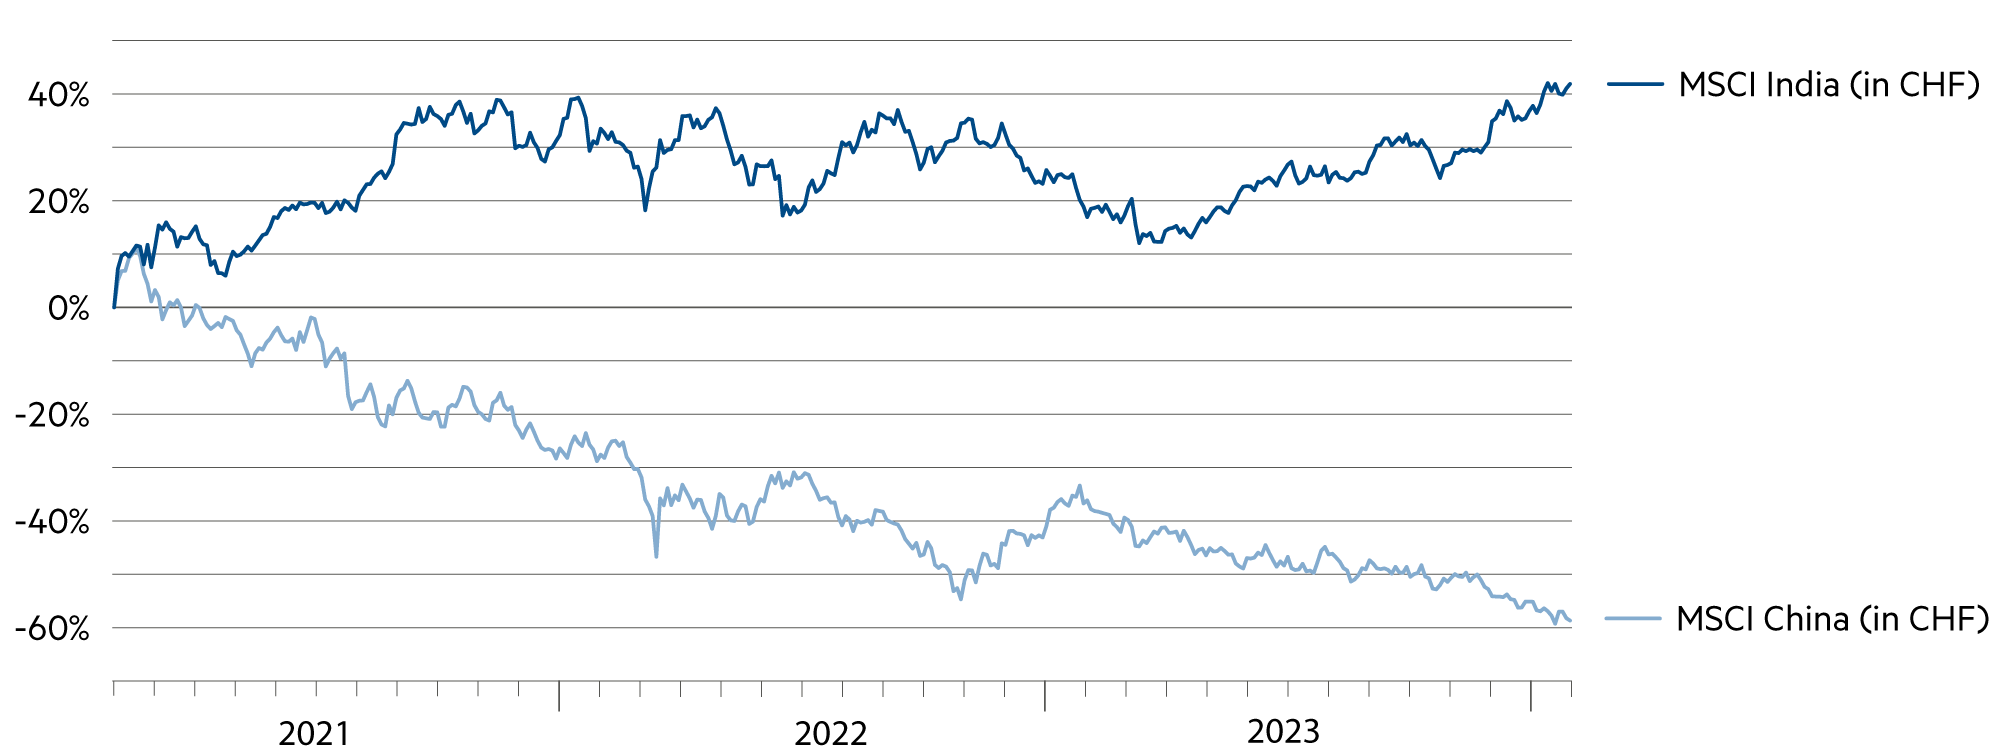
China’s stock market has long lagged well behind its global competitors. Since joining the World Trade Organization in 2001, China’s GDP has grown 13.6-fold, from around USD 1.3 trillion to around USD 17.7 trillion in 2023. This corresponds to an annual growth rate of +12.5%. In the same period, the Shanghai Composite only doubled (= annual growth rate of only +3.3%). The startling difference between the economy and equity goes back to the communist system, where the economic priority is not the wealth of equity owners.

We still don’t think much of the Chinese framework. There is no shareholder culture, in fact the state regularly forces companies to pay higher wages. The examples of Alibaba, Tencent and Baidu also show how the state intervenes directly in the shareholder and management structure.

In India, on the other hand, all the signs are “green”. Due to its market capitalization, the Indian stock market is now the fourth largest country market in the world. The government is promoting entrepreneurship and economic conditions through the largest infrastructure program in recent decades. The risk/return ratio for Indian equities remains favorable for patient investors.

The weighting is not large, but as part of a satellite in the overall portfolio, Indian entrepreneurship has a rightful place in our portfolios. Over the past three years, the difference in index performance converted into Swiss francs between the MSCI India (+38%) and the MSCI China (-58%) has grown to a whopping 96%.

Switzerland’s negotiations on a free trade agreement with the world’s most populous country are a fitting example of this. A basic agreement has been reached. Patent protection was controversial; investments are also to be better protected. An agreement with India should create jobs for India’s young population and secure Switzerland as a business location. Access to India’s “talent pool” is important for many Swiss companies. The country has a large number of well-qualified, English-speaking young adults with strong digital skills.

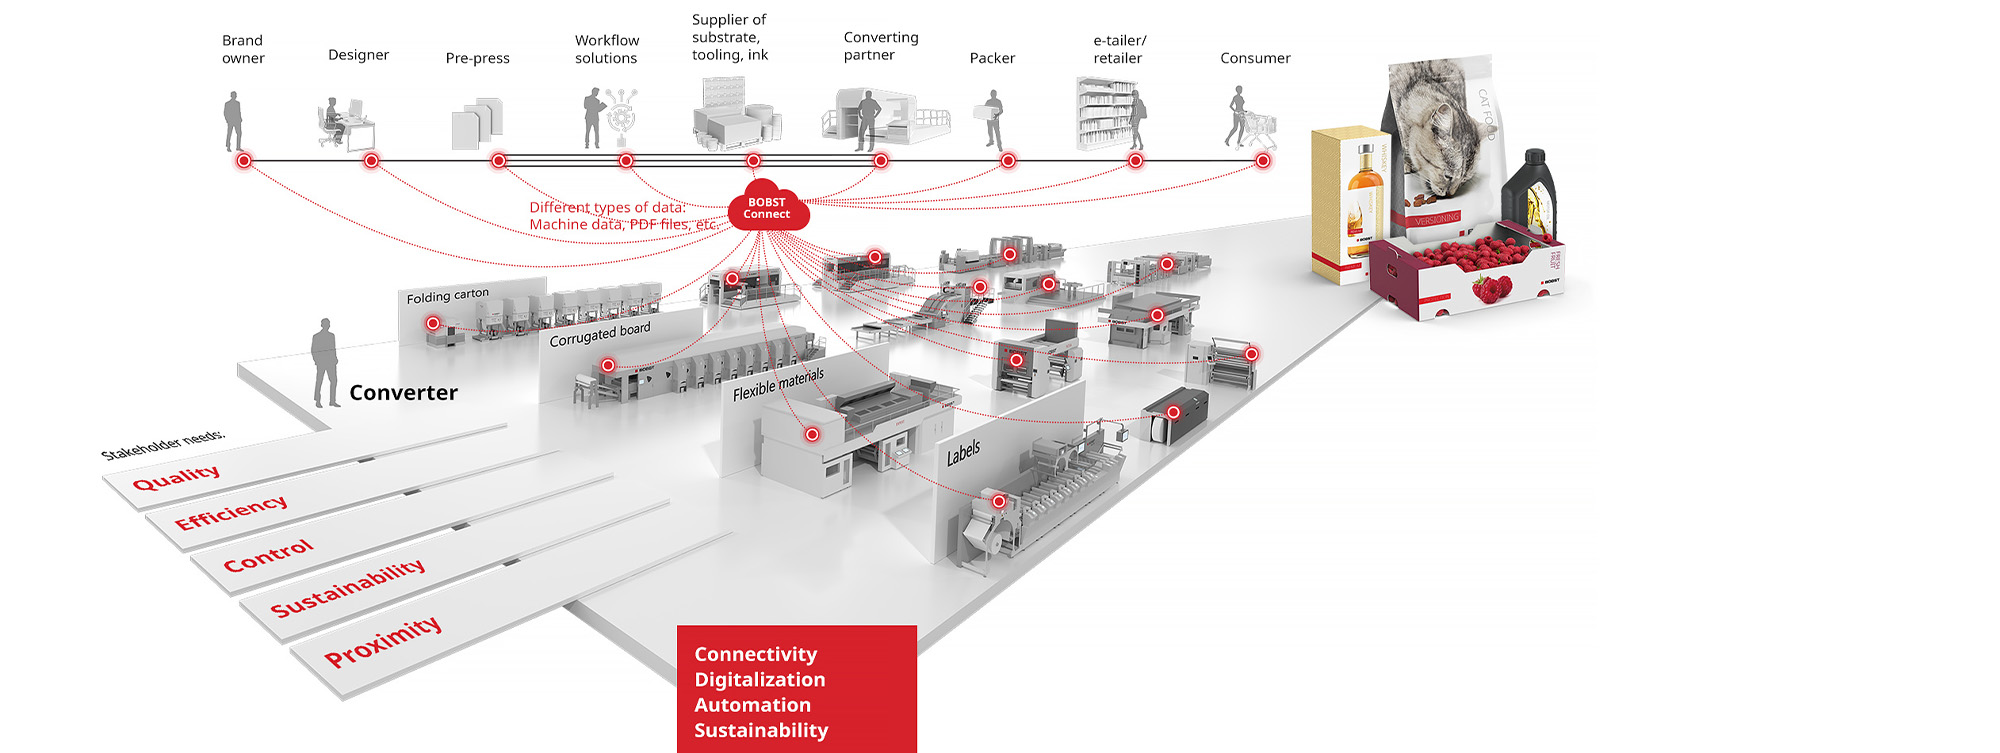
For years, Western companies relied on China as an extended workbench, but this is turning out to be a cluster risk. “The Indian market is becoming the logical alternative to China,” writes Switzerland’s State Secretariat for Economic Affairs in its latest country report. India will take on the role of global production site for low-cost machines, for example, for the French-speaking Swiss machine manufacturer Bobst. The company already employs 400 people in Pune, south-east of Mumbai, and plans to add several hundred more in the next two or three years.

Asset class 3–6 months 12–24 months Analysis
Bank account 
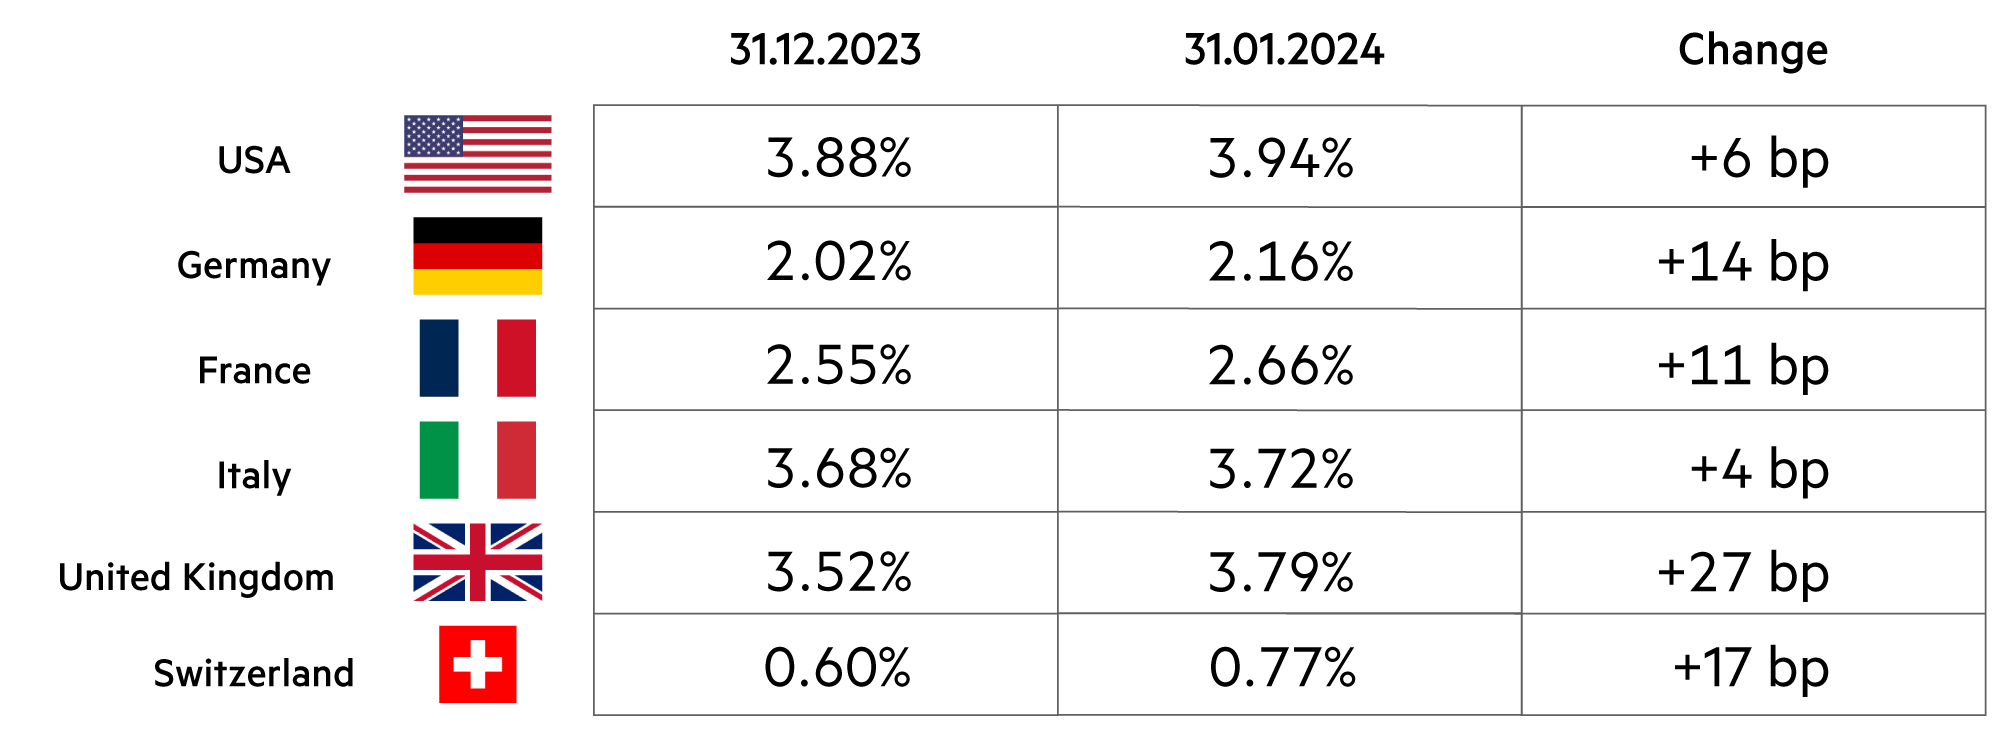
Inflation expectations are declining. Accordingly, key interest rates are also likely to be cut in Switzerland, which will put pressure on interest rates on bank accounts.
Euro / Swiss franc Over the course of the year, interest rate cuts in the eurozone are likely to be more pronounced than in Switzerland, which will significantly reduce hedging costs.
US dollar / Swiss franc At 0.86, the dollar gained 2.5% in January. But with hedging costs of 3.8%, they remain at a high level - with a slight trend towards a reduction.
Euro / US dollar At 1.08, the most important exchange rate pair is in a zone of relative stability. In the course of normalization, fluctuations are currently decreasing significantly.

Bonds

Technical correction of benchmark yields

In January 2024, yields on ten-year government bonds rose noticeably by around 10 to 20 basis points. This change did not stop at Switzerland. However, this does not mark a turning point. Rather, this countermovement is a technical correction after yields fell massively in the last quarter of 2023. However, the rise in yields meant that most benchmark bond indices suffered slight losses in January.

Read more Close
Government bond yields in January 2024 10 years, (Source: Bloomberg Finance LPs | Graphic: Zugerberg Finanz)

The World Bond Index (in Swiss francs) lost 0.5% in January 2024. The Swiss Bond Index was 0.6% lower than at the start of the year. The exaggerated expectations of rapid interest rate cuts by the central banks have thus been “priced out”.

However, this should not obscure the fact that we expect a positive overall return on bonds in the various segments over the course of this year. We have looked at the portfolios in their individual segments (investment grade, sub-investment grade; USD, EUR and CHF) and subjected them to various economic scenarios. Overall, we have come to the conclusion that another good investment year for fixed income has begun with the 2024 vintage.

Whether in late spring or early summer, it can be assumed that the major central banks will lower their key interest rates. This has already begun in emerging countries such as Mexico and Chile, as well as in China.

The scope for interest rate cuts is greater than it has been for 15 years. In the USA, key interest rates are currently in the range between 5.25% and 5.5%. With an inflation rate of 1.7% in the fourth quarter of 2023, this results in horrendously high real interest rates for all those who park their capital at the central bank instead of investing it. Small and medium-sized enterprises in particular, which employ around 90% of the workforce in the private sector, suffer as a result. They have to cope with tough financing conditions. Their capital costs are often in the region of 12% to 15%.

This is the main reason why the index of small capitalized companies (Russell 2000) lags significantly behind the S&P 500 Index, which is dominated by large, cash-flowing technology companies. In the last three years, the difference between these two US indices has risen to 39%.

In the latest “Beige Book” of the US Federal Reserve (Fed), in which the central bank representatives from its twelve regional economic areas report rather qualitatively, the main concern was that the Fed had raised real interest rates too high after all. As more and more small US companies are groaning under the high cost of capital, lending by commercial banks has actually increased. They are currently turning their already super-restrictive monetary policy into an above-average restrictive lending policy. The Fed is therefore likely to aggressively reduce its monetary policy soon (not just a quarter movement, maybe half of a percentage point at a time), thereby significantly easing the liquidity needs of SMEs.

Similar central bank decisions can also be expected in Europe with a certain delay. Overall, this should contribute to a good environment for corporate bonds. Fixed income remains an attractive asset class.

Asset sub-class 3–6 months 12–24 months Analysis
Government bonds With their catchphrase "data-driven, not date-driven", central banks reaffirmed their ability to react to real-time data and lower interest rates.
Corporate bonds In a resilient economy with low expected default rates, corporate bonds remain highly attractive.
High-yield, hybrid bonds The ECB's latest quarterly credit survey showed a significant improvement in credit demand and lending conditions.

Zugerberg Finanz bond solutions

Better than the Swiss Bond Index

At -0.1%, the Zugerberg Income Fund (ZIF) had a much better start to the new year than the Swiss Bond Index. The Credit Opportunities Fund (COF), which focuses less on interest rate risks and more on credit risk premiums, even gained 0.9% in January in an unfavorable bond environment. What both funds have in common is that they have an important buffer function in the context of overall portfolio management.

Read more Close
BOBST Industry Vision - Shaping the future of the packaging world (Source: BOBST Group)

Government bonds are currently being used in both vehicles, i.e. in both the ZIF and the COF, namely those with a long residual term. In view of the ongoing disinflation, an increased duration makes for a more attractive bond portfolio. This also provides a possible buffer or risk-reducing function among all bonds. Should there be a surprising slowdown in economic activity, these bonds are likely to experience a disproportionate increase in value.

However, the majority consists of corporate bonds, which are characterized by a particularly high credit rating in the ZIF and therefore have an extremely low default risk. Those who want to expose themselves to a low fluctuation risk in the current year are probably in good hands in risk class 1. Here, the proportion of ZIFs is significantly higher than all equities combined. The investor benefits from the fact that the exposure is primarily in bonds with longer maturities.

With COF, credit risk premiums are the main source of income and the average rating is noticeably lower than with ZIF. The additional return on corporate bonds compared to government bonds with the same maturity remains attractive at present because the economic situation does not indicate that there will be an unusually high number of corporate defaults.

A bond issued by the Vaud-based family business Bobst was recently included in the COF. The five-year bond issued by the successful mechanical engineering company yields 1.5% more interest than a comparable Swiss government bond. The company, led by CEO Jean-Pascal Bobst, has a turnover of around CHF 1.8 billion and is a leading global supplier of quality equipment and services for packaging and label manufacturers. The visionary company is regarded as highly innovative, is pursuing a convincing digitalization strategy (“BOBST Connect”) and has an excellent reputation among its loyal customers. The proceeds from the bond issue will be used to repay a previous bond and for general corporate purposes.

Zugerberg Income Fund Credit Opportunities Fund
Yield in 2023 (since the beginning of the year) -0.1% +0.9%
Yield since the start (annualized) -8.5% (-1.6%) +26.3% (+2.1%)
Proportion of months with positive yield 53% 67%
Credit risk premium in basis points (vs. previous month) 132 BP (-1 BP) 545 BP (-12 BP)
Average rating (current) A- BB+

Real estate, infrastructure

Lower rates are already having an effect

Central banks in Europe are still keeping key interest rates high, but inflation expectations have fallen significantly and lending conditions have improved. In Switzerland, multi-year fixed-rate mortgage loans are now available for less than 2% again. Building interest rates have also fallen in Germany, stabilizing the real estate market. The rental housing market remains tight and offers solid returns.

Read more Close
Schweizer Franken Swap Terminkurse in %, (Source: Bloomberg CHF SARON Swap Forward curve analyses | Graphic: Zugerberg Finanz)

The probability that interest rates for longer-term investments will rise in the current year is low. Anyone who has invested their surplus capital at current fixed-term deposit conditions must expect the renewal of these investments to be at a significantly lower interest rate level in six months’ time. Of course, it is impossible to say exactly, but the Swiss franc interest rate swap forward curve analysis as at June 30, 2024 and December 30, 2024, for example, does reveal a few things that support our hypothesis.

Investors who want to benefit from higher interest rates must now take advantage of the current window of opportunity to lock in these rates for longer. Depending on your risk appetite, one of our two bond solutions (ZIF and COF) is suitable for this. However, anyone thinking of renewing their mortgage loans this year can confidently tackle this in the coming days and weeks. The environment appears favorable, even for the renewal of maturities that will not fall due until the second half of the year.

There is no need to wait for interest rates to fall; with forward mortgages, future expectations can already be captured in the present based on the forward curve. The market has a healthy confidence that the monetary policy situation will normalize by the end of the year and that the SNB will return to a neutral key interest rate in the region of 1.0%.

This will stabilize rents and ease the burden on homeowners’ incomes, but also increase the attractiveness of yield-producing properties (apartment buildings with a low vacancy rate in cities or in growth regions close to cities). In the next one to two years, rising prices are foreseeable in all real estate segments, certainly for modern apartment buildings that meet current energy standards.

The lower the interest rates, the more attractive the cash flow yields from a real estate investment. They are therefore attracting growing interest again and are becoming more attractive compared to other asset classes, e.g. compared to ten-year Swiss Confederation bonds, which currently yield just under 0.8% and are therefore not even able to compensate for the loss of purchasing power due to inflation.

Bonds always remain nominal investments. Real estate, on the other hand, is a real investment, which is advantageous in the longer term. They respond to the strong fundamentals of the Swiss residential real estate market. If the demand for housing exceeds the supply – also due to the continuing high level of immigration (net of +100’000 in 2023) – this promotes the housing shortage and thus the willingness to pay for rental and owner-occupied properties. In addition, tenancy law makes it possible to respond to rising costs (inflation, interest on loans or reference interest rates) with higher rents.

Asset sub-class 3–6 months 12–24 months Analysis
Residential properties CH Fixed-rate mortgages in the 3 to 5-year range have become much more attractive and cheaper than Saron mortgages. Swap rates fell to 1.05% (1.77% as at 30.9.).
Office and retail properties CH The situation on the office market remains tense, including for retail space. Only a few city center locations are really in high demand.
Real Estate Fund CH Listed real estate funds are regaining upside potential thanks to falling interest rates, stable distribution yields and increased rental income.
Infrastructure Equity / Fund The prospects of far-sighted infrastructure companies will improve significantly over the course of 2024 thanks to falling financing costs.

Equity

Lower interest rates lead to higher valuations

We are observing a hesitant attitude towards equities in many places. This reinforces our belief that many professional players are still assuming structurally high interest rates and higher inflation rates. However, we believe that the return to lower interest rates is not just temporary, but permanent. Accordingly, we assume that Swiss equities in particular will see higher valuations in the medium term.

Read more Close

In the US, technology stocks are temporarily consolidating at a high level after an exhilarating 2023. The all-time high of the S&P 500 and the relatively low fluctuations on the North American capital markets should not tempt us to see the future only in rosy colors.

With our fundamental approach, we remain convinced that one must be extremely selective and examine each business model in detail – e.g. with regard to its economic resilience or pricing power and ongoing efficiency measures. High profits in the present can in no way be interpreted to mean that high earnings will also be generated in the future. The competitive constellation and the ability to innovate and adapt are key pillars that we analyze.

When it comes to artificial intelligence, for example, Microsoft Switzerland is already selling its solution to over 200 Swiss companies, such as Mobiliar Insurance, which has used it to make internal communication more efficient and make it easier for employees to access knowledge. In some places these are small improvements, in others productivity can be increased significantly. Hardly any company that wants to remain competitive can afford to stand on the sidelines.

Artificial intelligence increases the pressure on companies to reinvent themselves. This also affects entire supply chains, which is where SAP comes in. We are still convinced that we can find very good stock corporations at a fair valuation. One example that has convinced us for years is the Walldorf, Germany-based software group, which is undergoing a radical transformation and will “focus on key strategic growth areas”, above all artificial intelligence. The aim is to become the number one for business AI, said CEO Christian Klein. To achieve this, 8’000 jobs would be cut worldwide, which the Group would rebuild elsewhere.

AI will not only be used in the products, but also in the operational structure of SAP. The Walldorf, Germany-based company hopes that this will lead to “organizational synergy effects” – in other words, increased efficiency and productivity gains. According to the plan, the increased efficiency would contribute 500 million euros to operating profit next year. The operating profit for 2023 was 6.5 billion euros, although SAP has changed the basis of calculation here. For 2024, SAP expects an operating profit of 7.6 to 7.9 billion euros, an impressive increase of 17% to 21%. The target for 2025 is 10 billion euros.

With these figures, SAP has exceeded the expectations of most analysts. Investors were very pleased with both the annual results and the announcement of the AI transformation: With a January performance of +15%, the software manufacturer’s share price is significantly higher than at the start of the year, but our medium-term ambition level for this group is still far from being reached.

The founders of SAP once left the computer company IBM from secure employment to use their innovative strength to program the business software needed to manage a company in real time. Like no other company, SAP has data from all areas of the company, from production to finance to human resources. With AI, key steps can now be significantly optimized, and this generates SAP’s strategic position for success.

And never forget: Investing in equities is risky in the short term; not investing in equities is risky in the long term.

Asset sub-class 3–6 months 12–24 months Analysis
Equity Switzerland In Switzerland, not only the SMI heavyweights (Nestlé, Roche, Novartis) are relevant. There are a number of gems among smaller companies in particular.
Equity Eurozone, Europe The Euro Stoxx 50 contains a number of solid companies. Strong growth companies are more likely to be found in the Stoxx Europe 600.
Equity USA There are numerous gloomy prospects for the US stock market, but there are at least as many positive assessments, including for tech stocks.
Equity Emerging markets Mexico is benefiting disproportionately from the deglobalization and near-shoring of US industry in North America.

Alternative investments

Energy prices are falling

The normalization of the global economy is accompanied in particular by a normalization of energy prices. This is having a massive impact on current inflation as well as on inflation expectations. Wholesale gas and electricity prices in Europe have fallen to 10% of their highs. It is high time for suppliers to pass on the lower prices to private consumers and reduce their monopolistic profits again.

Read more Close
European gas prices normalize (Source: Bloomberg Finance | Graphic: Zugerberg Finanz)

Prices have also fallen so sharply because demand is declining. Switzerland is currently a good example of this. Switzerland is expected to achieve the voluntary gas savings target of 15% (or around 4’000 GWh) by the end of March 2024. From October to December 2023, around 71% of the targeted total volume has already been saved. Switzerland is thus making a joint contribution to the EU member states’ gas savings target in order to prevent energy supply bottlenecks in Europe.

The above-average warm temperatures in October and December, the still high end customer prices and awareness of the tense gas supply situation are likely to have contributed to the reduction in Swiss gas consumption. The moderate economic development has certainly also caused demand to fall. In any case, the current situation (January was also warmer than average) means that there is no need to take additional measures to save gas for the current winter.

With regard to crude oil prices, there are still risk factors in the Middle East (e.g. attacks on tankers in the Red Sea) that remain unpredictable. The positive update of the global economic growth forecasts by the International Monetary Fund for the current year (now +3.1% instead of +2.9% in October 2023) and further positive surprises from the resilient US economy have caused prices to rise somewhat on a speculative basis.

However, this overlooks the fact that economic growth has become decoupled from crude oil consumption. It is important to note that the major energy consumers in the economy, such as China, are constantly becoming more energy efficient. This also has to do with the fact that their growth impulses are shifting from energy-intensive infrastructure investments to lower-energy consumption. Added to this is China’s unexpectedly strong expansion in the area of solar energy production, which is increasingly replacing coal, diesel and gasoline. At the same time, China is investing heavily in grid expansion, digital energy control and energy storage.

It is also interesting to note that oil companies are holding back their investments in oil production in view of the outlook. The data and forecasts have led Saudi Aramco to put its current plans to expand capacity on hold. This points to weaker demand prospects. These are positive signals for inflation.

Asset sub-class 3–6 months 12–24 months Analysis
Commodities The Bloomberg Commodity Index remained unchanged in January, i.e. there were no relevant price changes in the commodities sector.
Gold, precious metals At CHF 1’762 per ounce, the price of gold remained roughly in line with its average price in recent months.
Insurance Linked Securities The niche market for ILS and subordinated insurance bonds will remain attractive in 2024, supported by a relatively low volume.
Private equity 2024 is likely to be an interesting year for private market investments. Numerous M&A and IPO transactions are already in preparation.

Summary

Asset class 3–6 months 12–24 months Analysis
Macroeconomics The economic tailwind from consumption continues. Rising disposable household incomes in real terms (nominal ./. inflation) are enabling a clear increase in GDP.
Liquidity, currencies The US Federal Reserve and the European central banks are likely to cut key interest rates in early summer. Any earlier changes would be surprising.
Bonds We continue to value fixed-income investments due to their attractive yields and their buffer function in the event of an economic downturn.
Real estate, infrastructure Infrastructure assets should also prove to be solid, purchasing power-enhancing real investments in 2024 due to lower interest rates.
Equities The general conditions will remain challenging, but market-leading companies will be able to cope with them better than average.
Alternative investments Alternative investments are suitable as a supplement to equities and bonds in order to genuinely diversify a mixed securities portfolio in real economic terms.

Market data

Asset class Price (in local currency) Monthly / YTD / Annual performance (in CHF)
Equity 31.01.2024 01/2024 2024 YTD 2023 2022 2021
SMI CHF 11'333.4 +1.8% +1.8% +3.8% –16.7% +20.3%
SPI CHF 14'774.5 +1.4% +1.4% +6.1% –16.5% +23.4%
DAX EUR 16'903.8 +1.4% +1.4% +13.1% –16.3% +10.4%
CAC 40 EUR 7'656.8 +2.0% +2.0% +9.6% –13.9% +23.6%
FTSE MIB EUR 30'744.2 +1.8% +1.8% +20.4% –17.3% +17.3%
FTSE 100 GBP 7'630.6 +0.7% +0.7% –0.3% –8.8% +16.7%
EuroStoxx50 EUR 4'648.4 +3.3% +3.3% +12.1% –16.0% +16.0%
Dow Jones USD 38'150.3 +3.7% +3.7% +3.5% –7.7% +22.2%
S&P 500 USD 4'845.7 +4.1% +4.1% +13.1% –18.5% +30.6%
Nasdaq Composite USD 15'164.0 +3.5% +3.5% +30.6% –32.3% +25.0%
Nikkei 225 JPY 36'286.7 +6.9% +6.9% +8.6% –19.7% –2.6%
Sensex INR 71'752.1 +2.0% +2.0% +7.4% –4.8% +23.2%
MSCI World USD 3'205.3 +3.6% +3.6% +10.8% –18.5% +23.7%
MSCI EM USD 975.8 –2.4% –2.4% –2.6% –21.5% –1.8%
Bonds (mixed) 31.01.2024 01/2024 2024 YTD 2023 2022 2021
Glob Dev Sov (Hedged CHF) CHF 154.5 –0.6% –0.6% +2.2% –13.2% –3.0%
Glob IG Corp (Hedged CHF) CHF 183.7 –0.4% –0.4% +4.2% –16.7% –2.0%
Glob HY Corp (Hedged CHF) CHF 338.8 –0.2% –0.2% +8.7% –13.6% +1.4%
USD EM Corp (Hedged CHF) CHF 263.6 –0.7% –0.7% +4.5% –18.2% –2.7%
Government bonds 31.01.2024 01/2024 2024 YTD 2023 2022 2021
SBI Dom Gov CHF 175.1 –2.5% –2.5% +12.5% –17.0% –4.2%
US Treasury (Hedged CHF) CHF 140.9 –0.6% –0.6% –0.5% –15.0% –3.5%
Eurozone Sov (Hedged CHF) CHF 180.4 –0.7% –0.7% +4.8% –18.9% –3.7%
Corporate bonds 31.01.2024 01/2024 2024 YTD 2023 2022 2021
CHF IG Corp (AAA-BBB) CHF 181.7 0.0% 0.0% +5.7% –7.5% –0.5%
USD IG Corp (Hedged CHF) CHF 187.6 –0.5% –0.5% +3.5% –18.5% –2.3%
USD HY Corp (Hedged CHF) CHF 584.6 –0.3% –0.3% +8.5% –13.7% +4.1%
EUR IG Corp (Hedged CHF) CHF 164.5 0.0% 0.0% +5.9% –14.1% –1.2%
EUR HY Corp (Hedged CHF) CHF 288.7 +0.6% +0.6% +9.8% –10.9% +3.2%
Alternative investments 31.01.2024 01/2024 2024 YTD 2023 2022 2021
Gold Spot CHF/kg CHF 56'482.5 +0.3% +0.3% +0.8% +1.0% –0.6%
Commodity Index USD 98.6 +2.4% +2.4% –20.4% +15.1% +30.8%
SXI SwissRealEstateFunds TR CHF 2'391.3 +2.2% +2.2% +5.4% –17.3% +7.6%
Currencies 31.01.2024 01/2024 2024 YTD 2023 2022 2021
US dollar / Swiss franc CHF 0.8614 +2.4% +2.4% –9.0% +1.3% +3.1%
Euro / Swiss franc CHF 0.9319 +0.3% +0.3% –6.1% –4.6% –4.0%
100 Japanese yen / Swiss franc CHF 0.5858 –1.8% –1.8% –15.4% –11.0% –7.5%
British pound / Swiss franc CHF 1.0929 +2.0% +2.0% –4.2% –9.3% +1.9%
Back to News