Monthly Report 03/2026

Publications

Slow start to the year

The global economy continues to show no signs of weakness. Global growth remains robust, with India posting the strongest growth of all G-20 countries. In Europe, the economy is also picking up noticeably again, while the US is experiencing a remarkable slowdown. The strongest growth region remains the Asian continent – interestingly, from the Middle East to India to the Far East, where an impressive wave of automation is taking place in view of the declining working population.

Investors are struggling with geopolitical developments. Risks have undoubtedly increased since the beginning of the year, partly due to the escalating conflicts in the Middle East. Risk premiums have risen, particularly for US equities. It remains completely unclear how artificial intelligence (AI), the “technology of the century,” will actually affect productivity, employment, and various work processes.

Presumably, productivity gains will not occur as quickly or to the extent that some analysts have suggested in their AI horror scenarios in recent weeks. Mood swings are likely to dominate events in the near future, and as is so often the case, warlike aspects will also come into play when the world order undergoes fundamental change.

Things picked up in February

After ending January slightly down, the portfolios are now all in positive territory. The increase was noticeably lower in the lowest risk class (+1.5%) than in the higher risk classes (+2.5% and +5.8% respectively). The Swiss Market Index (SMI) fluctuated massively over the last 30 days between its low on January 28 (13,023) and its high on February 27 (14,014), with the index rise mainly attributable to the three heavyweights.

By contrast, the global equity index improved only marginally in February (+0.4%), from -0.6% to -0.2% (in CHF). The weakness of the dollar (-2.9%) and the poor performance of technology and software-related stocks, which account for nearly 40% of the global equity index, continue to have a significant impact.

Returns in February did not simply depend on the size of the equity allocation, but also on the country and sector background. Portfolios with more technology and software stocks and commodities such as Bitcoin (-25%) did not perform as well as portfolios with a strong weighting in healthcare stocks (Novartis, Roche) and consumer goods stocks (Nestlé).

In the strategy with the lowest equity allocation (Revo1), performance benefited from the strong performance of bonds and stands at +1.1%. In the more equity-focused Revo4 and Revo5, the monthly return in February was +2.3% and +2.5% respectively. The dividend-focused RevoDividends rose in February (+5.8%) in line with the SMI and has gained +4.8% since the beginning of the year. It is important to note that these dividend-related solutions are also available in tied pension plans (3a, vested benefits) and are particularly attractive there because the high dividend income is not subject to income tax. Strategy changes can be implemented quickly and at virtually no cost. The DecarbRevo solutions continued their good start to the year in February. Performance continues to be driven by energy and energy infrastructure-related stocks such as ABB and Spain’s Acciona, Germany’s E.ON, Britain’s SSE, and France’s Engie. Such stocks lifted the DecarbRevo strategies to record highs.

Strategies mainly based on individual titles Strategy performance*
February 2026 2026 YTD
Zugerberg Finanz R1 +1.3% +0.8%
Zugerberg Finanz R2 +1.4% +0.3%
Zugerberg Finanz R3 +2.0% +0.7%
Zugerberg Finanz R4 +2.3% +1.1%
Zugerberg Finanz R5 +2.5% +0.7%
Zugerberg Finanz RDividends +5.9% +4.8%
Zugerberg Finanz Revo1 +1.5% +1.1%
Zugerberg Finanz Revo2 +1.5% +0.6%
Zugerberg Finanz Revo3 +2.0% +0.9%
Zugerberg Finanz Revo4 +2.3% +1.3%
Zugerberg Finanz Revo5 +2.5% +1.0%
Zugerberg Finanz RevoDividends +5.8% +4.8%
Zugerberg Finanz DecarbRevo3 +3.7% +8.1%
Zugerberg Finanz DecarbRevo4 +4.5% +10.1%
Zugerberg Finanz DecarbRevo5 +5.1% +11.3%
Zugerberg Finanz Vested benefits Strategy performance*
February 2026 2026 YTD
Zugerberg Finanz Vested benefits R0.5 +0.6% +0.5%
Zugerberg Finanz Vested benefits R1 +1.0% +0.4%
Zugerberg Finanz Vested benefits R2 +1.2% +0.2%
Zugerberg Finanz Vested benefits R3 +1.4% +0.2%
Zugerberg Finanz Vested benefits R4 +1.8% +0.7%
Zugerberg Finanz Vested benefits R5 +2.5% +0.7%
Zugerberg Finanz Vested benefits RDividends +5.9% +4.8%
Zugerberg Finanz 3a pension solution Strategy performance*
February 2026 2026 YTD
Zugerberg Finanz 3a Revo1 +1.5% +1.1%
Zugerberg Finanz 3a Revo2 +1.5% +0.6%
Zugerberg Finanz 3a Revo3 +2.0% +0.9%
Zugerberg Finanz 3a Revo4 +2.3% +1.3%
Zugerberg Finanz 3a Revo5 +2.5% +1.0%
Zugerberg Finanz 3a RevoDividends +5.8% +4.8%
Zugerberg Finanz 3a DecarbRevo3 +3.7% +8.1%
Zugerberg Finanz 3a DecarbRevo4 +4.5% +10.1%
Zugerberg Finanz 3a DecarbRevo5 +5.1% +11.3%
* The stated performance is net, after deduction of all running costs, excluding contract conclusion costs

Macroeconomics

Macroeconomic tailwinds and headwinds

We started 2026 with an optimistic outlook – but barely two months into the year, many of our assumptions are being called into question. Our cautiously optimistic assessment was based on the assumption that the macroeconomic headwinds from 2025 – from fiscal policy, economic and geopolitical uncertainty, and credit and monetary policy – would turn into tailwinds. In addition, the AI boom, with all the investment in data centers, seemed unstoppable.

Read more Close
Graphic: AI-generated

Each of these assumptions now appears more uncertain because political volatility has increased again. The US president appears to be intensifying military action against Iran, which is increasing geopolitical risks and causing oil prices to rise further, at least temporarily. With the nomination of Fed critic Kevin Warsh as Fed chairman, Donald Trump has also created more monetary policy uncertainty. Each of these assumptions now appears more uncertain because political volatility has increased again.
The US president appears to be intensifying military action against Iran, which is increasing geopolitical risks and causing oil prices to rise further, at least temporarily. Donald Trump has also created more monetary policy uncertainty with the nomination of Fed critic Kevin Warsh as Fed chairman.
The White House is already concerned about the “K economy,” as the announced “golden age” continues to fail to reach the majority of the population. As a result, the US president’s approval ratings have fallen within a year.
Until recently, things seemed at least somewhat rosy: gasoline prices in the US fell below $3 per gallon for the first time in months. With its military intervention in Venezuela, the White House secured access to the world’s largest reserves of heavy oil, practically on its doorstep.
However, the war against Iran is creating inflationary pressure, at least in the short term, which could have a significant impact on monetary policy decisions. With midterm elections coming up in around eight months, the US government is under strong pressure from Main Street to deliver on three promises: moderate inflation, stable employment, and consumer-friendly prices. In the longer term, these could actually materialize if OPEC production were to increase. If a new, liberal regime in Iran were to be exempted from sanctions, rock-bottom prices of $ 40 and a tailwind for the global economy would be conceivable.
The European economy is developing more calmly. Looking at North America and Europe together, they still account for 50% of global economic output from an economic perspective. But the unity of the global West is crumbling. The alliance between China, Russia, North Korea, and Iran has, in a sense, created the global East as an alternative system, which accounts for 25% of the world economy. Now, with Iran, an economy with 90 million inhabitants could break away from this alliance, thereby weakening Russia and China. India is trying to go its own way, on its way to becoming the world’s third-largest economy.
Despite increasing proximity to India and its domestic market, European countries and companies are still dependent on cooperation with China. Decades of investment have led to close interdependence along global supply chains. At the same time, Chinese companies are among the largest investors, especially in Eastern Central Europe.

Region 3–6 months 12–24 months Analysis
Switzerland The Swiss work for their money; the Americans let their money work for them and are increasingly dominating the Swiss stock market.
Eurozone, Europe Europe does not lack functioning stock exchanges, but rather the courage to invest capital in innovative companies: 43% of the DAX is owned by US investors.
USA Labor market statistics have been revised so drastically in the past that the current data cannot really be interpreted correctly.
Rest of the world President Xi Jinping is determined to maintain what is now only moderate growth in China – with a more expansionary monetary and fiscal policy.

Liquidity, currency

Inflation remains low

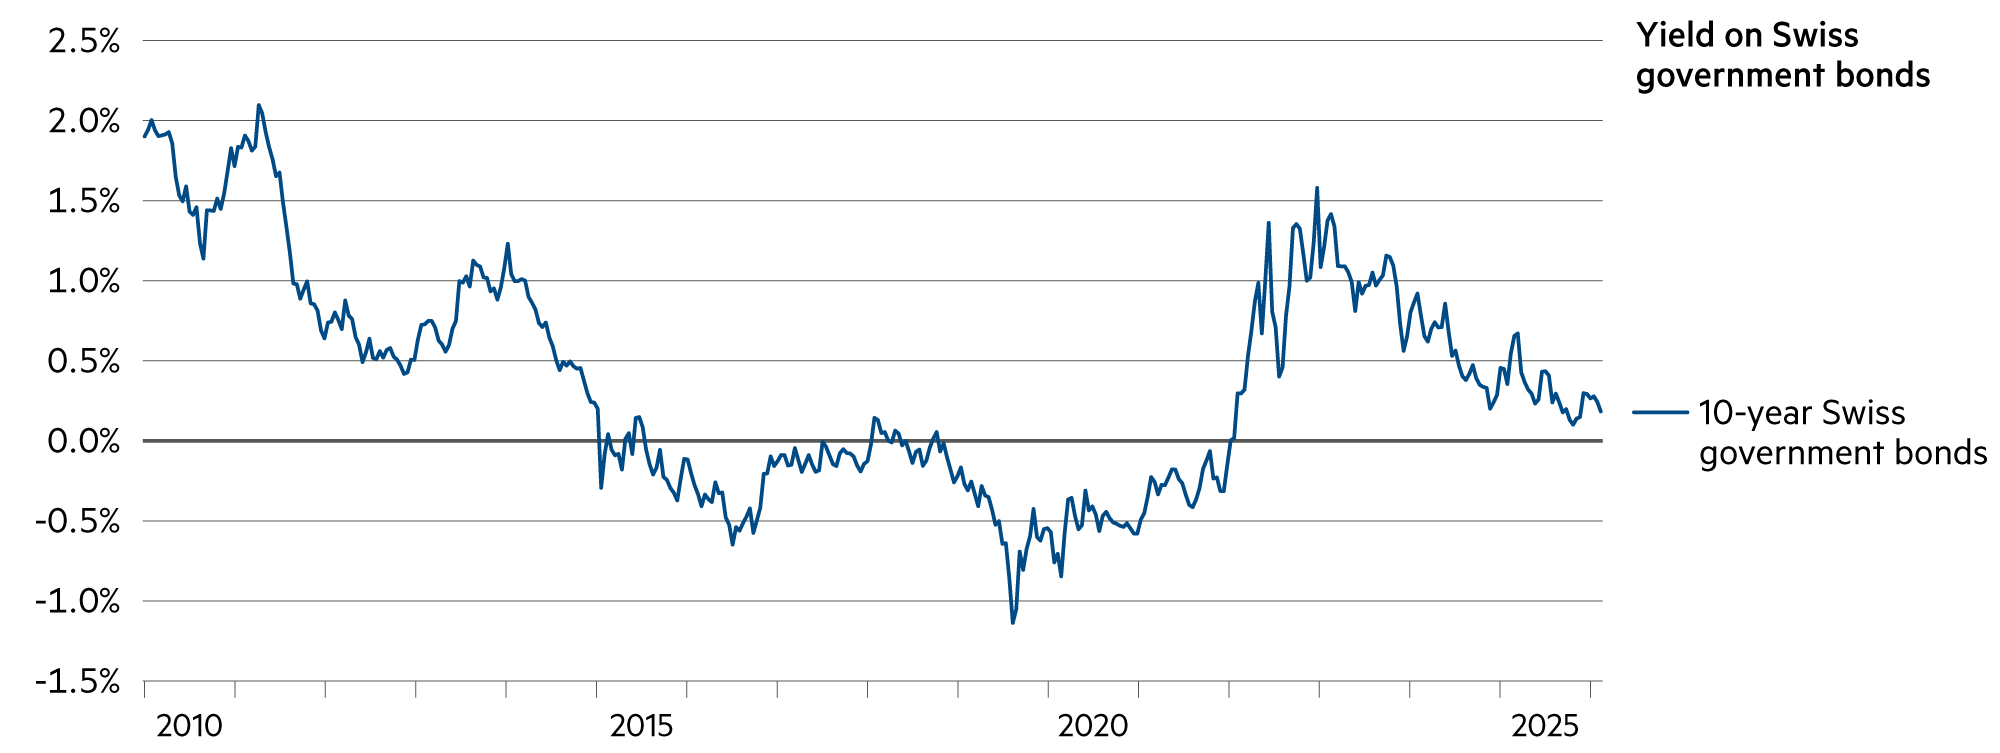
The Swiss franc remains a strong currency. Inflation is practically zero, which is why the Swiss National Bank’s monetary policy assessment in three weeks’ time is unlikely to give rise to any change in the key interest rate of 0%. The appreciation against the dollar and the euro in the first two months is now likely to give way to a period of stability lasting several months.

Read more Close
Swiss National Bank (Image source: stock.adobe.com)

Fundamentally, the dollar’s appeal as a safe haven is waning as US stocks appear riskier while stocks in other countries are improving. This is another observation from last year that continued in the first two months of 2026. A less attractive US currency increases the incentive for global investors to reduce their dollar exposure.

This was the case during the tech bubble at the turn of the century. It is entirely possible that the dollar will fall again if stock prices decline, just as it did during the dot-com phase in 2002 when stocks performed better elsewhere. At that time, however, there was also a series of negative stock market news from the US. Today, on the other hand, technological leadership in various fields remains unbroken, and sales and profit figures are rising rapidly.

The US stock market’s focus on AI and AI-related cannibalization risks are weighing on the US, while loose fiscal policy is benefiting stocks in the rest of the world. Nevertheless, the high costs of currency hedging are being dispensed with in many places. Over the past 12 months, average currency hedging costs have been above 4% (franc vs. dollar). It is quite possible that they will fall below 4% in the next 12 months, but they will certainly remain substantial.

The decision to increase hedging ratios is independent of more general geopolitical considerations that could lead to diversification away from the US currency. Some analysts maintain their pessimistic assessment of the dollar, as the currency may have lost its special status in terms of yield, growth, and security. In Europe, there are even dreams of digital sovereignty.

We are not guided by dreams, nor do we engage in fictional scenarios such as those recently circulated by Citrini Research. Market confidence may be fragile, and fears of AI disruption may still turn into widespread risk aversion in many industries.

However, the fact remains that the technological dominance of US companies such as Microsoft, Google, Amazon, Nvidia, and AMD is based on decades of investment in innovation – and on the ability to retain innovative and (highly) qualified employees with generous compensation packages. This can even be seen in high-wage Switzerland, where around 10,000 employees work for US tech companies, 6,000 of them for Google in Zurich alone – most of them with university degrees.

Asset class 3–6 months 12–24 months Analysis
Bank account The SARON swap rates, which are important in banking, are all negative in the range from one month to three years, mostly around -0.1%.
Euro / Swiss franc Over the past 12 months, the EUR/CHF exchange rate has fallen by around 3%. Most recently, the euro was trading at 0.91 francs with minor fluctuations.
US dollar / Swiss franc At the beginning of March, the dollar rose by around 1% due to the crisis in the Middle East. This is in line with the SNB's monetary policy objectives.
Euro / US dollar At the end of February, the EUR/USD stood at 1.18, virtually unchanged from the start of the year. The war in Iran is likely to strengthen the dollar (temporarily).

Bonds

Low key interest rates in Switzerland

With regard to monetary policy, it can be said that key interest rates in the eurozone are neutral. This is appropriate given the moderate inflation rates. In Switzerland, key interest rates are rather low, which is due to the strengthening of the Swiss franc. Key interest rates, like local inflation rates, are practically zero. From a historical perspective, the yield outlook for safe bonds remains low. The ten-year Swiss government bond with its AAA rating yields slightly less than 0.2% per annum.

Read more Close
The bond yield on ten-year Swiss government bonds (Source: Bloomberg L.P.; data from 1 January 2010 to 28 February 2026 | Graphic: Zugerberg Finanz)

With a cumulative return of 2% expected over the next ten years, very few investors are satisfied, especially since the Swiss Confederation’s long-term benchmark bond is subject to considerable price fluctuations. From a risk-adjusted perspective, it therefore makes sense to represent the stability component of the portfolio with a broadly diversified basket of corporate bonds rather than government bonds and mortgage bonds.

This is hardly possible with individual bonds. Many Swiss companies refinance themselves on the large euro capital market. Around 14,000 corporate bonds are listed there, but 86% of them are in institutional tranches, i.e., with a minimum investment of EUR 100,000. For some, the minimum volume is EUR 200,000 or higher. This means that they cannot be traded by private investors at all.

This is due to the legislator, who – as is so often the case on the capital market – wants to protect investors from risks that are supposedly too great for them. Interestingly, these restrictions do not apply to government bonds. In Italy, for example, these can be purchased in denominations of EUR 100 at any post office counter. It would be mischievous to think of the state’s financing needs on the bond market in this context.

Another important point is the right of termination. In the US in particular, but also in Northern Europe, many bonds provide for a specific right of termination for the issuer. However, this “make whole” clause is important because it enables the company to launch a long-term bond. 20- and 30-year corporate bonds are not uncommon, but they exclude tradability for private investors.

For this reason, the investment world for bonds is practically limited to active funds and passive ETFs due to regulations, even for corporate bonds with a high rating. Passive vehicles suffer from the fact that they have to reflect the market. When data center-related bonds are issued on a large scale, as is currently the case, they all flow into the ETF. This means that the character of an ETF can change fundamentally in a relatively short period of time.

Our experience has shown that an active approach to the bond market pays off. Incidentally, we have not participated in the recent wave of data center-related issues. On the contrary, we have proactively reduced the risks. As an integrated portfolio manager across multiple asset classes, it makes a lot of sense to limit cumulative risks from an industry that could potentially manifest itself in parallel on the equity and bond sides in a timely manner.

Asset sub-class 3–6 months 12–24 months Analysis
Government bonds With low interest rates and rising government debt, the safety function of government bonds in a multi-asset class portfolio is eroding.
Corporate bonds Eurobonds remain a questionable idea. Corporate bonds offer more substance and the chance of higher returns.
High-yield, hybrid bonds The fundamental environment for investment-grade corporate bonds is in place, especially now that the specter of inflation has disappeared.

Zugerberg Finanz bond solutions

Robust start to the new year

The Zugerberg Income Fund (+1.3%) and the Credit Opportunities Fund (+0.6%) are already showing noticeable gains after just two months, with low volatility. We continue to see opportunities for returns for the rest of the year. The high-yield bond market in particular has developed into a significantly higher-quality market than in the past and now offers a compelling combination of attractive returns, lower risk of loss, daily liquidity, and strong yields across various economic cycles. Within 13 years, 100 francs turned into around 140 francs.

Read more Close

The Credit Opportunities Fund (COF), which is also more than 30% invested in investment grade bonds, tends to take advantage of the potential offered by high-yield bonds in the more conservative upper segment. This is why the average rating is also comparatively high at BB+. The Zugerberg Income Fund, on the other hand, remains clearly focused on corporate bonds with an even higher rating (A-).

In the previous section, we discussed cumulative risks. Specifically, one must imagine that a cloud provider such as Oracle must finance its immense expansion plans in the area of data centers. Internal financing through freely available cash flows from ongoing business is limited because the investment plans exceed the funds released. Accordingly, the company resorts to external financing.

External financing can be achieved by issuing shares, but this is associated with a dilution of profits for existing shareholders. Alternatively, it can be achieved by issuing bonds, which temporarily increases interest expenses and also reduces profit prospects, but to a lesser extent than issuing shares.

Against this backdrop, Oracle has issued bonds worth around $50 billion over the past nine months. More are likely to follow in the coming years. However, some investors have become more skeptical about the prospects for profitability. As a result, many Oracle bonds are already trading well below their issue price just a few months after being issued. The share price is now 56% lower than it was around five months ago. It is precisely this cumulative risk (lower share prices + lower bond prices for the same company) that needs to be avoided.

Anyone in Switzerland who experienced the grounding of the SAir Group (in the early years of Zugerberg Finanz) understands this as well. At that time, the shares fell rapidly, but the bonds also lost massive value and ultimately became worthless.

A cumulative risk can also occur within a single industry, e.g., due to the global AI scare triggered by a single analysis report on February 12, which claimed that logistics companies would become obsolete. On the stock side, this affected Kühne+Nagel (-13% in a few hours), for example, and on the bond side, Scan Global Logistics, for example. Their bonds fell rapidly to 90% in the same hours of overreaction. Since then, both stocks and bonds have largely recovered.

Nevertheless, asset managers can only control cumulative risk if they know every detail of the individual bonds in the fund or ETF. It is currently assumed that the US bond market will be used for data center-related transactions for just under 20% of issues in 2026.

This may turn out well for ETF investors, but there is certainly less certainty about this. We, on the other hand, actively spread our corporate bonds across around 18 sectors. This results in better sector diversification. Resilience is not needed in fair weather, but rather when a single sector in particular suddenly comes under severe pressure. This is where we see the value of active selection with our own bond solutions.

Zugerberg Income Fund Credit Opportunities Fund
Yield in 2025 (since the beginning of the year) +1.3% +0.6%
Yield since the start (annualized) -5.4% (-0.7%) +39.7% (+2.5%)
Proportion of months with positive yield 57% 68%
Credit risk premium in basis points (vs. previous month) 93 BP (+2 BP) 358 BP (-64 BP)
Average rating (current) A- BB+

Real estate, infrastructure

Strong price increases in two months

In Switzerland, our selection of real estate stocks rose sharply in the first two months. Shares in infrastructure companies operating primarily internationally also outperformed the market by a wide margin. Zurich Airport shares performed solidly, while BKW suffered a setback due to write-downs.

Read more Close

Our Swiss real estate selection has performed well so far this year. Swiss Prime Site (+19%), PSP Swiss Property (+15%) and Mobimo (+9%) have posted above-average gains since the beginning of the year. The Swiss Real Estate Fund Index (CHREF) remained moderate with a return of (+1.4%), but was still slightly higher than the SXI Real Estate Funds Index (+1.1%) calculated by the Swiss Stock Exchange.

Zurich Airport is a “hybrid” company that combines elements of both a real estate and an infrastructure company, with a total of over 150 properties and a concession business that enables it to operate an international airport. Airport fees will be reduced by around 10% over the next four years. At the same time, Flughafen AG is guaranteed a good return on capital. This will please shareholders in the coming years. This year, the stock, which is typically not very volatile, has already risen significantly again (+5%) and recently reached an all-time high. In addition, there will be a substantial increase in dividends in the spring.

The only negative surprise in our allocation of real estate and infrastructure stocks came from BKW (-10%), because the company made a significant write-down in fiscal year 2025 due to a valuation adjustment of around CHF 110 million on its 33% stake in the German Wilhelmshaven hard coal-fired power plant. The reasons for this are changed electricity market conditions, lower production, and less price volatility.

Infrastructure stocks performed extremely well, e.g., Enel (+15%). From 2026 to 2028, the energy supplier will invest EUR 53 billion, a large part of which will go toward expanding the energy grid and adding wind energy and battery storage to its portfolio. Shareholders’ profit sharing is also set to increase. Dividends are expected to rise by around 6% annually over the next three years. Enel shares thus remain one of the most exciting large utility stocks in Europe – with high dividends, a clear focus on profitable networks and renewable energies, and a valuation that has not yet reached its full potential.

Two other infrastructure companies, Vinci (+17%) and Veolia Environnement (+21%), have had a good start to the new year. Vinci generates around two-thirds of its operating profit from premium toll road and airport concessions. Veolia is the world’s leading provider of environmental solutions (water, waste, energy) for private households, businesses, and the public sector. The stock recently continued its strong upward trend and is proving to be a stable, high-growth stock. The “GreenUp” strategy (2024 to 2027) focuses on decarbonization, climate change adaptation, and water recycling around the globe.

Engie (+29%) is a typical stock that benefits indirectly from long-term AI development. The energy supply business model is exposed to lower risks. Nevertheless, these “AI companies beyond the spotlight” are significantly cheaper and deliver higher dividends.

Incidentally, our investment solutions in the decarbonization sector are benefiting particularly from the upward trend among energy infrastructure companies. Depending on the equity allocation, these have gained between 8% and 11% since the beginning of the year (see DecarbRevo on page 2).

Asset sub-class 3–6 months 12–24 months Analysis
Residential properties CH This is an interesting asset class in the long term. Life insurer Swiss Life has had an apartment building in Bern on its balance sheet since 1897 (!) as its longest-held investment.
Office and retail properties CH Real assets such as real estate are essential in a portfolio, and we consider a mix of residential and commercial real estate to be most attractive.
Real Estate Fund CH Real estate is a stabilizing factor in a portfolio. However, careful selection is preferable to a passive Swiss real estate fund index (CHREF).
Infrastructure Equity / Fund Energy infrastructure stocks in particular have performed well globally in the first two months of the year.

Equity

Artificial intelligence (AI) dominates

The AI euphoria has increasingly given way to AI anxiety, which is affecting numerous industries. This groundbreaking technology is certainly causing upheaval, but many reactions seem exaggerated to us. After just two months, market developments are already leading to different trends and valuations between individual industries.

Read more Close

Cloud providers: Amazon (-9%), Microsoft (-19%) and Alphabet (unchanged) It is unclear whether and when the huge investments in the cloud will pay off. Close attention is being paid to the “current cloud backlog” (CCB) figure, i.e. the order situation for future cloud services. At SAP (-18%), the CCB recently grew by “only” 25% instead of the expected 26%, which led to a sharp drop in the share price.

Software: After years of growth, fears arose worldwide that AI would replace software. Microsoft and SAP are just two examples; IBM, Salesforce, Oracle, and Adobe are others. Europe’s largest software distributor, Also (-24%), also suffered. However, their solutions are so deeply embedded in everyday business life with all its complex supply chains that no financial manager can afford to do without them.

Technology and energy: Three European companies have been competing for years to lead new, promising markets. As ABB (+21% to a new all-time high) explains, the clear focus is on electrification and automation. This is reflected in a new corporate structure with three business units and shared sales and technology opportunities. Siemens, 5% below its all-time high and the most valuable stock in the German DAX index, has recently suffered losses because its industrial software is considered vulnerable to AI. Schneider Electric (+18%) remains a beneficiary of the high demand for data centers, as do (in)directly small caps such as VAT Group (+41%) and Accelleron (+18%).

Construction industry and chemicals: Amrize (+13%), a building materials group focused on the US market, started the new year on a confident note. Holcim (-9%) saw consolidation at a high level following the sharp rise in the previous year – partly due to the uncertainty created by the EU regarding the framework conditions for the green transformation of the cement industry. Construction chemicals group Sika (-2%) is gradually emerging from its slump. Its rising dividend and the company’s own forecasts for 2026 are indicative of its entrepreneurial confidence. The strategy and growth targets for 2028 were confirmed. Geberit (+5%) performed in the middle of the SMI.

Healthcare: The heavyweight pharmaceutical companies lifted the SMI in the first two months. Roche (+12%) and Novartis (+19%) also outperformed the MSCI Healthcare. The eye care company Alcon (+6%) kept pace with the SMI. In contrast, the promising pharmaceutical supplier Lonza (unchanged)  fell short of our expectations.

Telecommunications: This is a winning sector. Sunrise (+16%), Swisscom (+25%) and Deutsche Telekom (+23%) are in demand, with the latter two benefiting from their enormous infrastructure, which can be used and leased profitably. Deutsche Telekom can even integrate AI directly into its network. For users, this could bring a whole new telephone experience – with chatbots and live translations, provided they use the “Magenta AI Call Assistant.”

Insurance: Insurance stocks have been down slightly worldwide since the beginning of the year, affected by fears surrounding AI and the associated pressure on premiums. This pattern has also been observed in Switzerland since the beginning of the year: Helvetia Baloise, Swiss Life, and Zurich Insurance (each down 4%). Shares in Swiss Re (+2%) and Axa (+1%) are up slightly.

Utilities: As in the previous year, shares in this sector have continued to rise overall since the beginning of the year. We highlighted this in particular in the section on real estate and infrastructure.

Asset sub-class 3–6 months 12–24 months Analysis
Equity Switzerland Fundamentally, Swiss companies' earnings growth cannot keep pace with share price performance. This is a sign of stagnation at a high level.
Equity Eurozone, Europe Investing in fragile stock markets requires time and patience. Europe has many gems that pay regularly high dividends.
Equity USA The tech sector has delivered, but fears surrounding AI are causing a noticeable sector rotation. Nevertheless, we expect a robust recovery on a fundamental basis.
Equity Emerging markets In emerging markets, semiconductor-related stocks and stock markets performed particularly well in January, while AI-related stocks plummeted.

Alternative investments

Private market providers under pressure

After a good start to the year, private market company Partners Group (-13%) has come under severe pressure, like others in the industry. As a result of AI fears in the software industry, the worst-case scenarios spilled over to private market managers because they were said to be sitting on excessively high private equity and private debt investments in companies at risk of disruption. Partners Group rejected the collective blame, arguing that it was significantly less exposed than its competitors. Its share price fell by 20% in five weeks.

Read more Close
VAT Group (Haag / Rhine Valley, Canton of St. Gallen)

Institutional investors are increasingly focusing their private market allocation on return quality and liquidity without fundamentally questioning their strategic allocations, according to a study by McKinsey. Recently, distribution dynamics have gained in importance. 54% of the investors surveyed rate this as the most important criterion. The greatest risks are considered to be delayed exits (company sales or IPOs), temporary lack of liquidity (70%), and valuation discounts (62%), as are currently feared in the case of software company investments.

However, distributions in 2025 fell well below the ten-year average. In addition, there have recently been delayed IPOs and uncertainties surrounding AI-related valuation discounts. Nevertheless, around 70% of institutional investors plan to maintain or expand their private market portfolios this year. This is because the software industry in particular is adapting to AI at a particularly rapid pace. The example of Google Gemini shows that those who embed AI in their solutions gain market share.

Globally, patient private investors are currently able to buy into various markets at favorable prices. Secondary market vehicles, for example, are available for this purpose. Private investors have so far invested very little in private markets (equity, infrastructure, loans), which is why the larger players in the industry, such as Partners Group, are confident that they will be able to attract significantly more capital over the next eight years. A wide variety of vehicles are currently trading at a 20% to 30% discount to net asset value (NAV).

The listed private market providers are grouped together in one fund in our portfolios: LPActiveValue. Although the return since the beginning of the year has slipped significantly into negative territory (-11%), it is considerably less than comparable passive ETF instruments. This is also due to the fact that the fund comprises more European positions than US providers and more of those that have recorded substantial value growth in recent quarters – such as the Swiss investment company HBM Healthcare Investments.

The exposure to Bitcoin has not yielded any benefits so far this year. In risk class 5 (with a 2.5% portfolio share), the negative return contribution has risen to -0.8% of the total portfolio.

Asset sub-class 3–6 months 12–24 months Analysis
Commodities Commodity prices remain volatile, oscillating between record highs and losses. This even applies to industrial metals such as copper and aluminum.
Gold, precious metals The price of gold rose to $5,400 per troy ounce at the beginning of March. It can certainly be considered a sensible addition to a risk-averse portfolio.
Insurance Linked Securities Insurance-related bond risks are genuine diversifiers and will continue to be used in our vested benefits solutions.
Private equity In 2026, there are still good signs that Partners Group's business model will continue to be profitable. The dividend yield has risen to 5.7%.

Summary

Asset class 3–6 months 12–24 months Analysis
Macroeconomics The economic recovery in Europe will continue in spring 2026 and is likely to accelerate, particularly in the second half of the year.
Liquidity, currencies A new Fed chairman (Kevin Warsh) could launch a new round of quantitative easing and cut key interest rates, which could cause currency relations to fluctuate.
Bonds With inflation expectations firmly anchored, longer-term interest rates in various currencies are quite solid and show relatively low volatility.
Real estate, infrastructure After an exceptionally good start to the year in the first two months, (energy) infrastructure-related stocks are well above the benchmark.
Equities The sector and style rotation continued in the first two months. This reduced the previous concentration on megacap IT companies.
Alternative investments The war in Iran has already led to sharply higher oil and gas prices in the tense run-up to the conflict. However, a lasting price shock is not expected.

Market data

Asset class Price (in local currency) Monthly / YTD / Annual performance (in CHF)
Equity 28.02.2026 02/2026 2026 YTD 2025 2024 2023
SMI CHF 14'014.3 +6.3% +5.6% +14.4% +4.2% +3.8%
SPI CHF 19'255.7 +5.7% +5.7% +17.8% +6.2% +6.1%
DAX EUR 25'284.3 +2.1% +0.8% +21.6% +20.4% +13.1%
CAC 40 EUR 8'580.8 +4.7% +2.7% +9.4% –1.0% +9.6%
FTSE MIB EUR 47'209.9 +2.8% +2.6% +30.0% +14.1% +20.4%
FTSE 100 GBP 10'910.6 +4.4% +6.5% +14.1% +12.1% –0.3%
EuroStoxx50 EUR 6'138.4 +2.3% +3.4% +17.3% +9.6% +12.1%
Dow Jones USD 48'977.9 –0.2% –1.3% –1.3% +22.1% +3.5%
S&P 500 USD 6'878.9 –1.3% –2.6% +1.7% +33.4% +13.1%
Nasdaq Composite USD 22'668.2 –3.8% –5.5% +5.2% +39.2% +30.6%
Nikkei 225 JPY 58'850.3 +8.8% +13.8% +10.9% +15.2% +8.6%
Sensex INR 81'287.2 –0.9% –8.7% –9.3% +13.8% +7.4%
MSCI World USD 4'556.8 +0.2% –0.3% +4.4% +26.6% +10.8%
MSCI EM USD 1'610.7 +5.0% +11.1% +14.1% +13.6% –2.6%
Bonds (mixed) 28.02.2026 02/2026 2026 YTD 2025 2024 2023
Glob Dev Sov (Hedged CHF) CHF 153.3 +1.3% +1.0% –1.0% –1.4% +2.2%
Glob IG Corp (Hedged CHF) CHF 189.2 +0.8% +0.9% +2.5% –0.8% +4.2%
Glob HY Corp (Hedged CHF) CHF 381.6 +0.1% +0.5% +5.4% +6.1% +8.7%
USD EM Corp (Hedged CHF) CHF 290.9 +0.9% +1.1% +5.9% +2.4% +4.5%
Government bonds 28.02.2026 02/2026 2026 YTD 2025 2024 2023
SBI Dom Gov CHF 188.0 +0.1% +0.9% –0.2% +4.0% +12.5%
US Treasury (Hedged CHF) CHF 140.2 +1.5% +1.1% +1.7% –3.8% –0.5%
Eurozone Sov (Hedged CHF) CHF 180.0 +1.3% +1.8% –1.8% –0.8% +4.8%
Corporate bonds 28.02.2026 02/2026 2026 YTD 2025 2024 2023
CHF IG Corp (AAA-BBB) CHF 194.4 +0.5% +1.1% +0.7% +5.1% +5.7%
USD IG Corp (Hedged CHF) CHF 191.5 +1.0% +0.9% +3.1% –2.4% +3.5%
USD HY Corp (Hedged CHF) CHF 632.7 –0.1% +0.1% +4.0% +3.7% +8.5%
EUR IG Corp (Hedged CHF) CHF 170.6 +0.4% +1.0% +0.7% +2.0% +5.9%
EUR HY Corp (Hedged CHF) CHF 313.1 +0.1% +0.6% +2.8% +5.4% +9.8%
Alternative investments 28.02.2026 02/2026 2026 YTD 2025 2024 2023
Gold Spot CHF/kg CHF 130'563.6 +11.8% +18.6% +43.8% +36.0% +0.8%
Commodity Index USD 121.7 +0.4% +7.5% –2.9% +8.3% –20.4%
SXI SwissRealEstateFunds TR CHF 3'025.7 +0.2% +1.4% +9.9% +16.0% +5.4%
Currencies 28.02.2026 02/2026 2026 YTD 2025 2024 2023
US dollar / Swiss franc CHF 0.7693 –0.5% –2.9% –12.8% +7.8% –9.0%
Euro / Swiss franc CHF 0.9085 –0.9% –2.4% –1.0% +1.2% –6.1%
100 Japanese yen / Swiss franc CHF 0.4931 –1.3% –2.5% –12.1% –3.4% –15.4%
British pound / Swiss franc CHF 1.0375 –1.9% –2.8% –6.1% +6.0% –4.2%
Back to News