Monthly Report 04/2026

Publications

Forecasts hold

Judging by the daily news, one might think that a significant slump in global economic growth is to be expected. However, this underestimates the resilience of the various growth hubs. In the latest study by the Organization for Economic Cooperation and Development (OECD) released at the end of March, the growth forecast for the G20 countries was even raised slightly. In December, the OECD projected real growth of +2.9%; its forcasts are meanwhile at +3.0%.

Certainly, the energy price shock caused by the war in Iran is leading to higher inflation rates around the globe. But the economic outlook remains clearly positive. Other expert panels also do not anticipate a significant slowdown in economic activity. The economy continues to be shaped by a strong period of investment in artificial intelligence and automation.

The most severe impacts are the higher prices for energy and fertilizers in poor countries. Added to this are declining remittances from migrant workers in the Gulf states. Furthermore, global financing conditions have deteriorated due to higher interest rates. In Europe, the effects remain manageable. The war in Iran, for example, has so far had only a moderate impact on the business climate. Even in Germany, the business climate has hardly deteriorated.

The slight decline in response to the war in Iran cannot be compared to the sharp slumps seen during the COVID-19 pandemic in the spring of 2020 or Russia’s invasion of Ukraine in 2022. Rising defense and infrastructure investments and an overall confident services sector are more significant.

In March, we made changes

Geopolitical and economic conditions have changed noticeably in recent months. Against this backdrop, we reviewed our portfolios and made targeted adjustments in specific areas. A key focus was on further diversifying our international equity investments. In selected regions, we reduced the weighting of individual stocks and partially replaced them with broadly diversified ETF solutions. This reduces specific individual stock risks while simultaneously increasing the stability of our international equity allocation.

In the Swiss market, we remain true to our proven strategy and continue to strengthen our focus on high-quality companies with stable dividends and solid business models. History shows a solid excess return in this segment, which is primarily generated through consistent dividend payments.

These adjustments are being made in line with our long-term investment philosophy and are intended to further optimize the risk profile of the portfolios and make them more diversified and resilient under current market conditions, without compromising long-term return potential. We continue to closely monitor developments in the capital markets and will adjust the portfolios carefully and incrementally as needed.

Uncertainty surrounding energy prices will certainly continue to shape developments in the equity and bond markets. Yet, given the flood of news, it may come as a surprise that the setbacks in our strategies have been relatively moderate since the start of the year. In the lowest risk class (Revo1: -2.2%), the setback is smaller than in higher risk classes (Revo3: -3.8%, Revo5: -4.8%). The dividend-focused strategy has been slightly in the red since the start of the year (RevoDividends: -1.7%).

Strategies mainly based on individual titles, supplemented by ETFs and investment funds Strategy performance*
March 2026 2026 YTD
Zugerberg Finanz R1 –3.0% –2.2%
Zugerberg Finanz R2 –3.6% –3.3%
Zugerberg Finanz R3 –4.3% –3.6%
Zugerberg Finanz R4 –4.9% –3.9%
Zugerberg Finanz R5 –5.1% –4.4%
Zugerberg Finanz RDividends –5.7% –1.2%
Zugerberg Finanz Revo1 –3.2% –2.2%
Zugerberg Finanz Revo2 –4.0% –3.5%
Zugerberg Finanz Revo3 –4.6% –3.8%
Zugerberg Finanz Revo4 –5.2% –4.0%
Zugerberg Finanz Revo5 –5.7% –4.8%
Zugerberg Finanz RevoDividends –6.2% –1.7%
Zugerberg Finanz DecarbRevo3 –3.4% +4.5%
Zugerberg Finanz DecarbRevo4 –3.5% +6.2%
Zugerberg Finanz DecarbRevo5 –3.8% +7.1%
Zugerberg Finanz Vested benefits Strategy performance*
March 2026 2026 YTD
Zugerberg Finanz Vested benefits R0.5 –2.1% –1.6%
Zugerberg Finanz Vested benefits R1 –2.7% –2.3%
Zugerberg Finanz Vested benefits R2 –3.2% –3.0%
Zugerberg Finanz Vested benefits R3 –3.6% –3.4%
Zugerberg Finanz Vested benefits R4 –4.8% –4.1%
Zugerberg Finanz Vested benefits R5 –5.1% –4.4%
Zugerberg Finanz Vested benefits RDividends –5.7% –1.2%
Zugerberg Finanz 3a pension solution Strategy performance*
March 2026 2026 YTD
Zugerberg Finanz 3a Revo1 –3.2% –2.2%
Zugerberg Finanz 3a Revo2 –4.0% –3.5%
Zugerberg Finanz 3a Revo3 –4.6% –3.8%
Zugerberg Finanz 3a Revo4 –5.2% –4.0%
Zugerberg Finanz 3a Revo5 –5.7% –4.8%
Zugerberg Finanz 3a RevoDividends –6.2% –1.7%
Zugerberg Finanz 3a DecarbRevo3 –3.4% +4.5%
Zugerberg Finanz 3a DecarbRevo4 –3.5% +6.2%
Zugerberg Finanz 3a DecarbRevo5 –3.8% +7.1%
* The stated performance is net, after deduction of all running costs, excluding contract conclusion costs

Macroeconomics

Uncertainty and Concern

Recent events in the Middle East have triggered significant uncertainty and concern among investors worldwide. In these difficult times, however, it remains essential to pause, reflect, and assess the potential impact on assets as well as the overall market outlook. Our base case continues to assume robust global economic growth, which will also be associated with positive prospects for real assets, partly due to the investment cycle surrounding AI.

Read more Close
CAPEX in the U.S. – real, seasonally adjusted. (Source: LSEG Datastream | Chart: Zugerberg Finanz)

As the war in Iran has now entered its second month and oil prices remain high, the market is increasingly viewing this not merely as a “temporary” shock. Instead, some are even leaning toward a scenario of a “war of attrition” with all the consequences that entails for commodity markets such as oil, gas, helium, fertilizers, etc.

However, the disruption of physical energy supplies through the Strait of Hormuz is also leading to energy-saving and rationing measures. Among the further consequences is certainly the rapid pass-through to higher freight and logistics costs, which is likely to be reflected in higher industrial and service prices. Furthermore, the significant economic interdependence between the Gulf region and Asia is often underestimated. Numerous migrant workers in the Gulf region send significant remittances to their home countries. When tourism grinds to a halt, these payments decline in parallel. There are thus second-round effects, but their global scale remains manageable.

However, unlike during the Covid era, there is no global supply chain problem. Commercial shipping across the Atlantic and the Pacific is proceeding without disruption. We therefore consider the OECD’s significantly higher inflation forecasts for 2026 to be premature. In the eurozone, the inflation target is 2 percent. In February, inflation rose from 1.7% to 1.9%, and the March figure was significantly higher at 2.5% on a core basis.

In periods of high uncertainty, central banks now work with various scenarios. If the oil price reaches new records above $160 per barrel (159 liters), this could be accompanied by significantly higher inflation rates in the U.S. and Europe.

However, none of this can be compared to the oil price shocks of previous years. After all, the main cause ultimately lies not with the OPEC production cartel, but in the “Situation Room” at the White House in Washington. That is where the decision is made as to when the de facto blockade of the Strait of Hormuz for oil, gas, and fertilizer shipments will be lifted. What happens behind the scenes cannot be reliably assessed from the outside.

It is interesting to note that the OECD slightly raised its latest growth forecast for the G20 countries – from +2.9% to +3.0%. If the blockade were to last a few more weeks, that would not pose a problem for the sustained growth of the global economy. However, if the blockade were to last three to six months, the consequences would be clearly felt.  The OECD urged governments worldwide to reduce energy consumption and promote energy efficiency in order to ease the burden on households and businesses and reduce vulnerability to geopolitical risks.

Region 3–6 months 12–24 months Analysis
Switzerland A certain degree of recovery is expected in the medium term. Growth of +1.3% is projected for the full year 2026, followed by around +1.5% in 2027.
Eurozone, Europe Europe’s growth in 2026 will be somewhat more subdued than expected. Domestic issues and rising energy prices remain an obstacle to fully realizing its potential.
USA Rising energy prices are curbing other forms of consumption. Were it not for the massive investments in AI, economic growth would slow noticeably.
Rest of the world The outlook for the global economy is subject to significant risks, particularly due to developments in the Middle East.

Liquidity, currency

Stability of the Swiss Franc

We continue to expect the franc to remain stable. Although the Swiss National Bank’s (SNB) conditional inflation forecast for the coming quarters is slightly higher than in December due to rising energy prices, medium-term inflationary pressures have hardly changed since the last economic assessment. Monetary policy is helping to keep inflation within the price stability range and is supporting economic development.

Read more Close
The SNB’s inflation forecast, March 2026. (Source: Federal Statistical Office, SNB | Chart: Zugerberg Finanz)

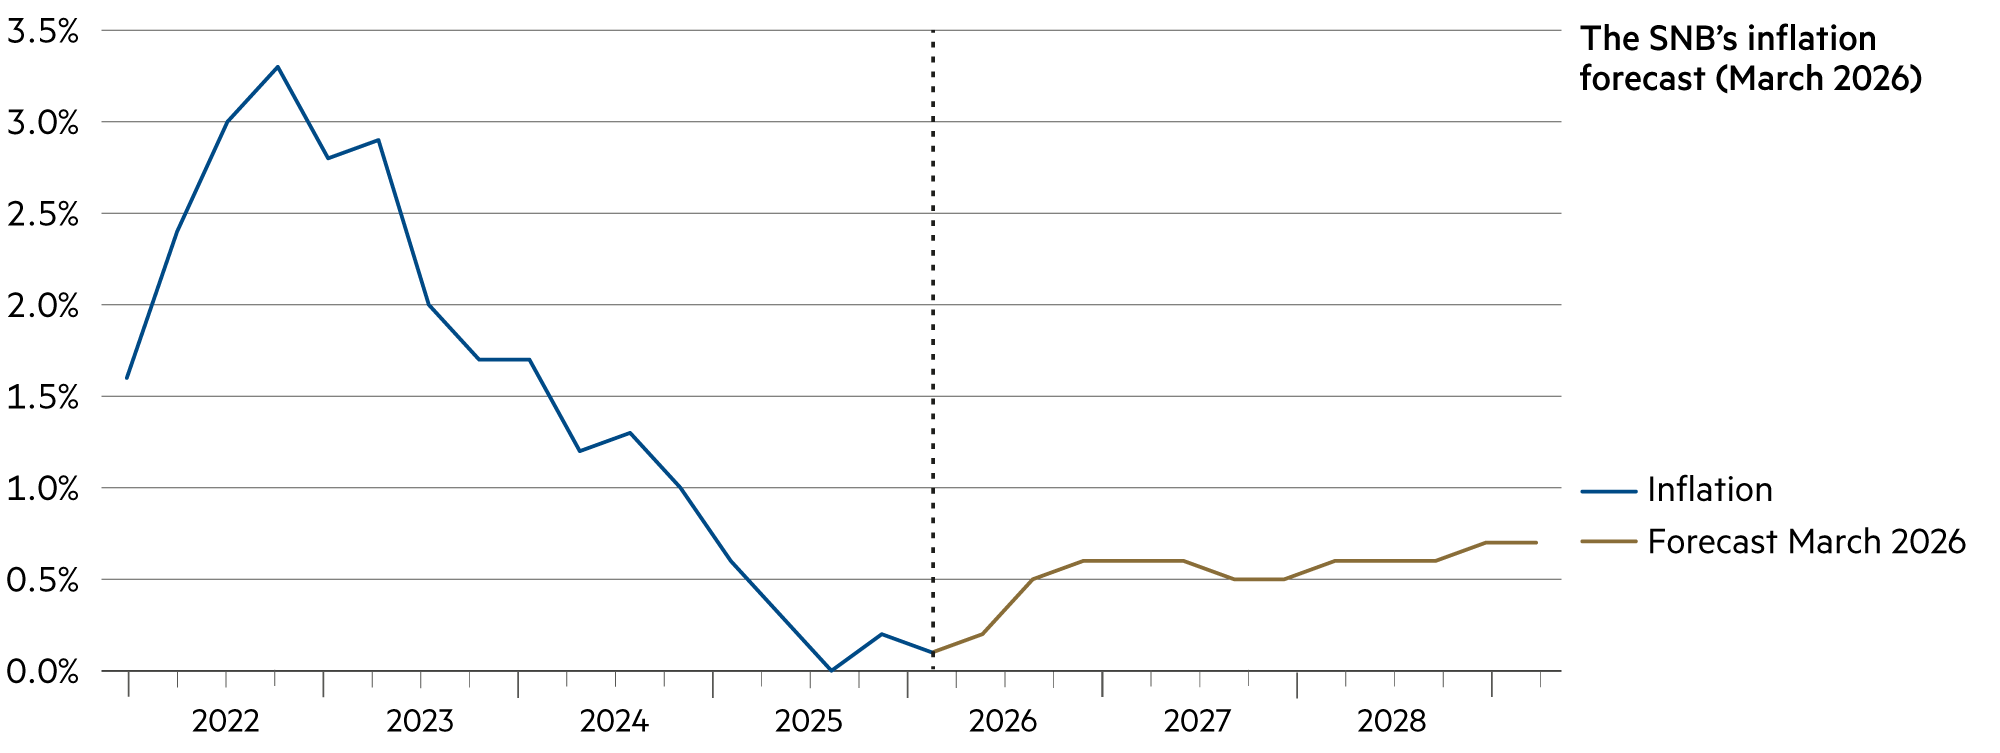
The National Bank will continue to monitor the situation closely and adjust monetary policy if necessary to ensure price stability in the medium term. As expected, inflation has risen slightly since the SNB’s last assessment of the economic situation, from 0.0% in November 2025 to 0.3% in March 2026 (Y-o-Y). Higher commodity prices have contributed in particular to this increase.

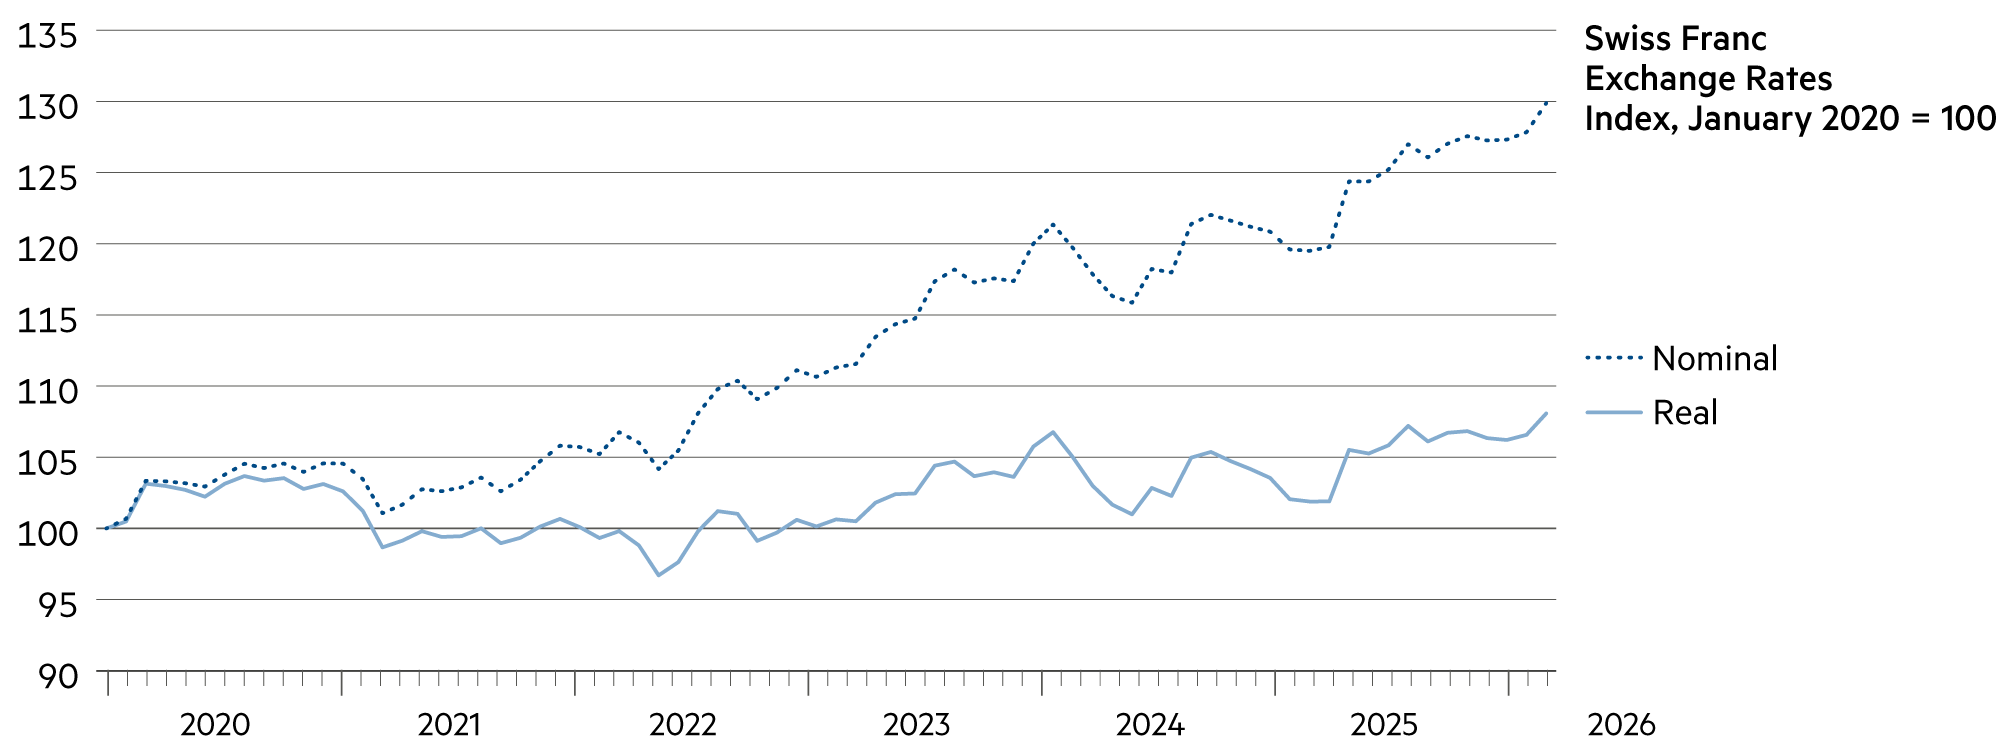
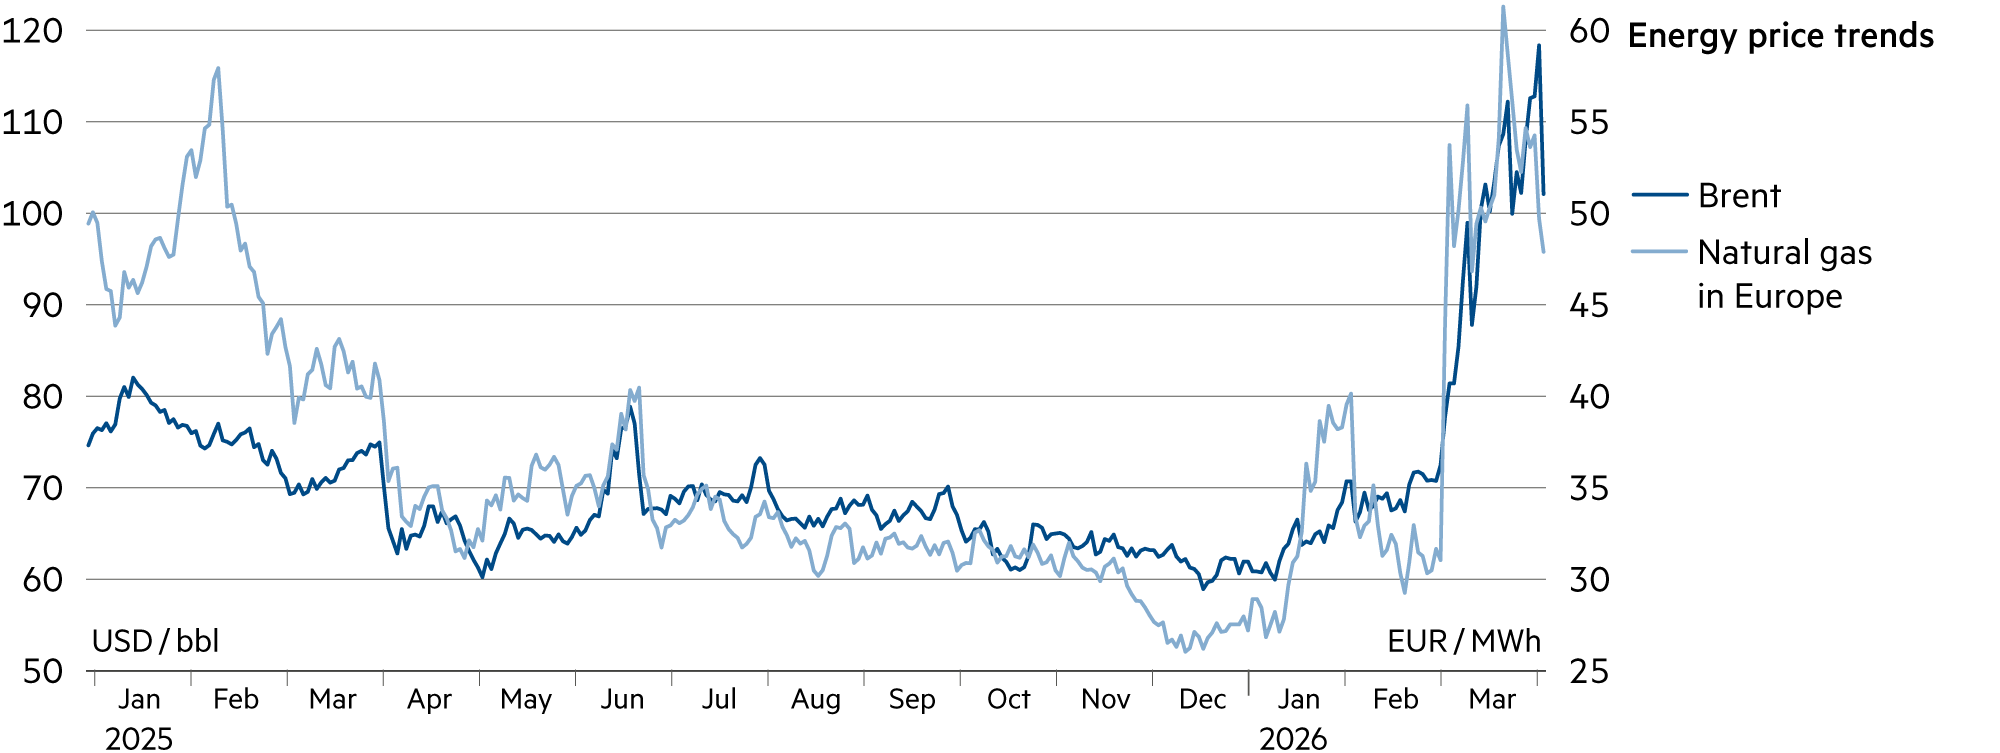
With energy prices rising due to the escalation in the Middle East, inflation is likely to increase more sharply in the coming quarters, though the stronger Swiss franc will counteract this in the medium term. On a trade-weighted basis, the Swiss franc has appreciated by around 2.5% since mid-December. Consequently, the SNB forecasts annual average inflation rates of 0.5% (2026 and 2027) and 0.6% (2028).

This is a far cry from the inflation spike of 2022 and 2023, which was temporarily associated with inflation rates exceeding 3%. The annual average inflation rate in 2022 was 2.8%.

Because interest rates in Switzerland are significantly lower than abroad, this makes investments in Swiss francs less attractive to foreign investors and thus counteracts upward pressure on the currency. The stimulative effect of low interest rates is also evident in the robust growth of credit in Switzerland. In this way, the SNB’s monetary policy supports economic development.

Conversely, franc investors who invest their capital abroad face the question of whether at least part of this exposure should be hedged. Hedging costs against the dollar stood at around 3.9% annually at the end of March, and around 2.3% against the euro.

Ultimately, the franc’s appreciation is largely driven by the inflation differential. It makes imports cheaper. If these imports are processed into higher-value goods through corresponding productivity improvements, the Swiss economy can tolerate the resulting increase in export prices. A moderate appreciation of around 2% to 3% per year is like a constant fitness regimen for local companies. They must constantly and continuously improve in order not to lose international competitiveness.

Moreover, the SNB rightly emphasizes that stable and favorable economic conditions – including price stability – are more important today than ever. Price stability is a key prerequisite for growth and prosperity in Switzerland. Stable prices provide planning certainty and thus facilitate purchasing and investment decisions. Stable prices benefit everyone, but they particularly protect lower-income households, which are most vulnerable to losses in purchasing power caused by inflation – that is, by (sharp) rises in consumer prices.

Asset class 3–6 months 12–24 months Analysis
Bank account 
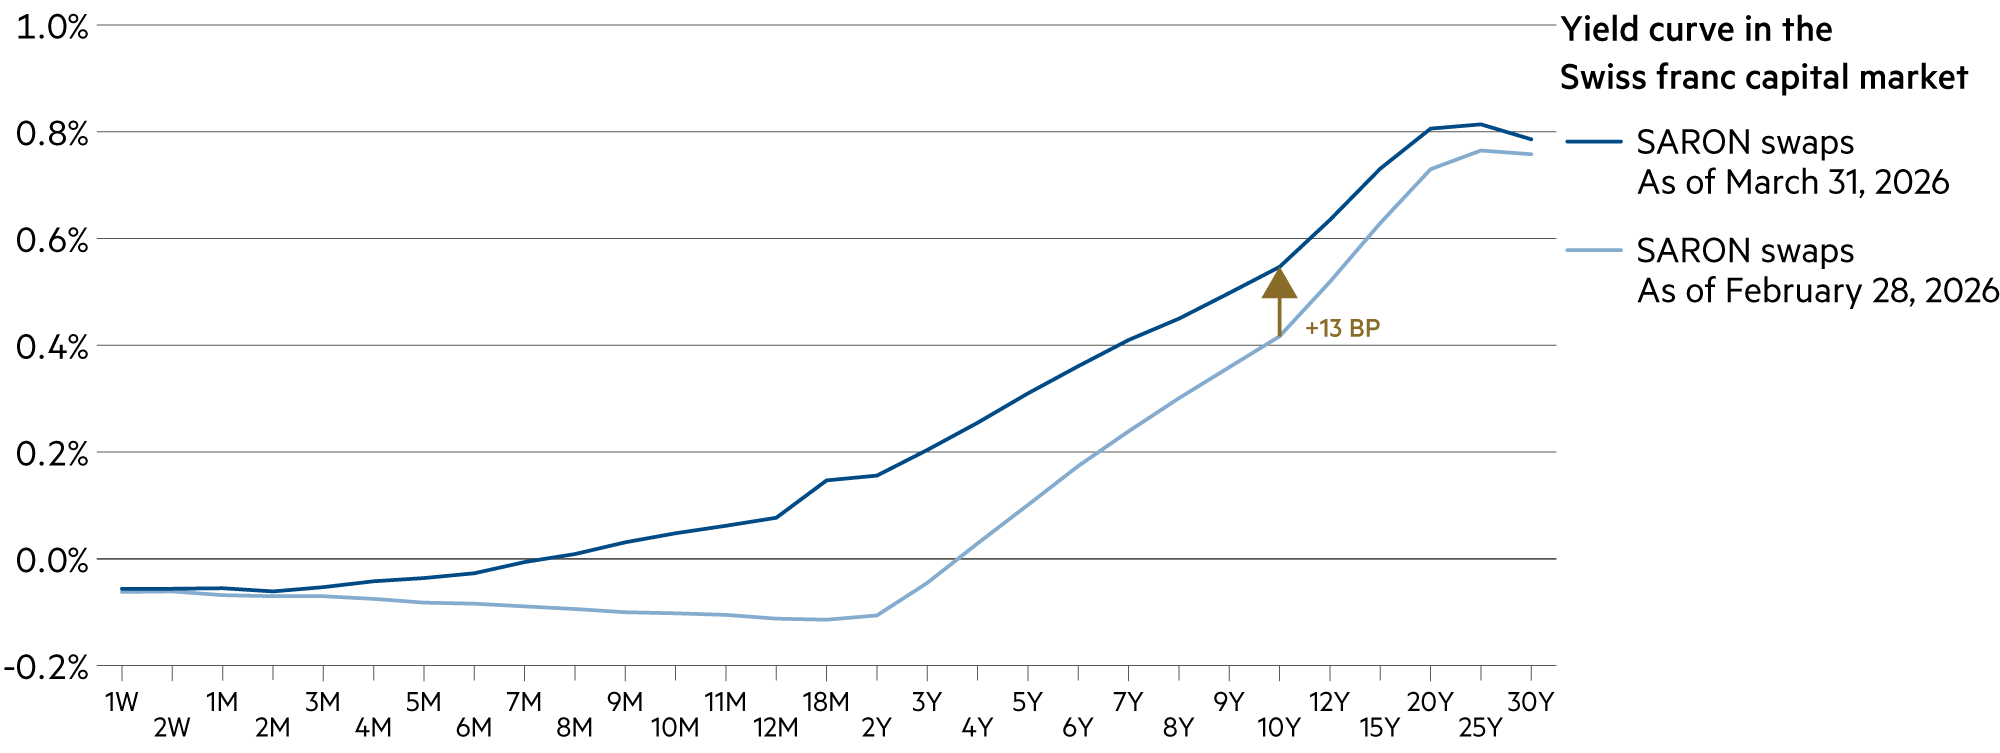
SARON swap rates are slightly negative in the short-term segment (up to 6-month maturity). In contrast, 10-year bonds are yielding +0.3%.
Euro / Swiss franc Rising yields in the eurozone drew investors back to the euro. The EUR/CHF exchange rate rose in March from 0.90 (March 6) to 0.92 (March 31).
US dollar / Swiss franc The trend toward easing in US interest rates has come to a halt. This strengthened the dollar. The USD/CHF exchange rate rose from 0.77 at the end of February to 0.80 (March 31).
Euro / US dollar With the EUR/USD exchange rate at 1.15, the market has stabilized. Real growth rates across the economic regions are expected to converge in the coming period.

Bonds

No interest rate hike during the crisis

Rising energy prices have been accompanied by higher inflation expectations. This poses a new challenge for central banks, especially if the higher energy prices cause inflation to rise more sharply than anticipated. But should the response be to raise key interest rates? It’s not that simple. However, the bond and credit markets have reacted sharply in recent times.

Read more Close
Swiss franc yield curve comparison: End of February vs. end of March 2026 (Source: Bloomberg L.P.; data as of February 27 and March 31, 2026 | Chart: Zugerberg Finanz)

Certainly, macroeconomic forecasts would first need to be revised to account for the possibility of interest rate hikes should oil prices, for example, reach $200 – instead of the current level of around $100. This could lead to stark inflation forecasts, but such inflation concerns seem unfounded to us. Certainly, we will keep an eye on the entrenchment of inflation due to second-round effects, especially since these influence medium-term inflation expectations.

However, raising interest rates at this point would not curb supply-driven inflation but would instead harm the economy as a whole. Raising key interest rates during war-induced stagflation would only exacerbate this crisis. Incidentally, an economic downturn tends to be accompanied by falling price levels, not rising ones, which would amplify the effect.

Given this aspect of demand destruction, we do not expect interest rate hikes, even if the market is currently pricing them in. In the eurozone, the market anticipates a rise in key interest rates from an effective 1.9% to 2.6% in the fall of 2026. In the base scenario, that would entail two to three rate hikes.

The European Central Bank (ECB) is in a good position to wait and see how data develops. We also consider interest rate hikes by the US Federal Reserve (Fed) to be unlikely at present, as are rate cuts, which US President Donald Trump would like to see.

The yield curve in the Swiss franc capital market has shifted upward. For 10-year bonds, yields are 13 basis points higher (from 0.42% to around 0.55%). However, these are the smallest yield increases globally over the past month.

For 10-year government bonds, for example, the increase in the UK was 44 basis points to 4.9% and in Italy 36 basis points to 3.9%. In Germany, too, the recent yield level on 10-year Bundesbonds – just over 3.0% – has not been seen in 15 years. This means that an extremely large number of negative consequences are already priced into benchmark bond yields. Possibly too many.

And yet, the capital market is sending warning signals. On March 11, the German government was left holding the bag on offered government bonds during a routine auction. The market signal was clear: We won’t buy all of your debt. The U.S. Treasury Department learned the same lesson: Interest rates had to be raised significantly at both the short end (+31 basis points to 3.8%) and the long end (+14 basis points to 4.3%) in order to sell the Treasury bonds.

Asset sub-class 3–6 months 12–24 months Analysis
Government bonds Bond yields have risen significantly, more so abroad than domestically, driven by concerns over inflation and growth. Stagflation would be bad.
Corporate bonds The sharp rise in yields on “risk-free” government bonds, combined with higher credit risk premiums, led to (still moderate) declines in bond prices.
High-yield, hybrid bonds Hybrid bonds have corrected somewhat more sharply compared to the spreads in the high-yield segment, which remain relatively stable.

Zugerberg Finanz bond solutions

Significant changes in March

At the end of February, we were able to report encouraging performance, but bond markets changed significantly in March. The monthly performance of the global bond index (-3.4%) pushed the benchmark for global bonds into negative territory since the start of the year (-1.5%). Our funds are also in this territory, but by no means to such a significant extent: The Zugerberg Income Fund and the Credit Opportunities Fund (both -0.7%) held up relatively well in terms of performance, with lower volatility.

Read more Close
Real Exchange Rates of the Swiss Franc (Source: SNB | Chart: Zugerberg Finanz)

Thus, the bond solutions have fulfilled their primary role in a diversified portfolio. They are intended to serve as a safety buffer and fluctuate significantly less than equities. But one can never completely avoid global events. When uncertainty arises, risk premiums widen across the board, driven by concerns about economic, sector-specific, and company-specific developments.

It is not surprising that credit risk premiums in the segment with higher credit quality (e.g., ZIF) widened less sharply than those in the segment with lower credit quality (COF). However, the significantly shorter average remaining maturity ensured that the decline was limited.

Another factor is currency trends. The Swiss franc appreciated not only in nominal terms but also in real terms during the first quarter of 2026. This has led to low inflation expectations. However, since yields – particularly on longer-term corporate bonds – have risen, we have increased our exposure in this area: For example, with a 6-year Swiss franc bond from insurance broker Chubb at 1.0% and an 8-year bond from Georg Fischer with a coupon of 1.65%. We also acquired a similarly profitable bond from energy provider E.ON with a 12-year maturity. This will generate solid interest income in the coming years.

In the ZIF, prices fell immediately after Easter when the withholding tax credits from interest income were transferred to the Federal Tax Administration. In our tied pension solutions (3a, vested benefits), such credits are routinely reclaimed and returned to client portfolios. For non-tied assets, the refund is processed as part of the tax return declaration.

For us, the main scenario is a de-escalation in the Middle East during the second quarter. According to betting odds, there is a 70% probability that the Strait of Hormuz will be navigable again by the end of June. This would lead to falling prices in the energy markets and cause globally available household income to rise again. In particular, inflation expectations could decline, which would cause bond prices to rise again.

However, oil and gas infrastructure cannot be switched on and off overnight. The resumption of full operations (production, refining, transportation) is likely to take longer than some believe, as a significant portion of the infrastructure is still damaged and must first be repaired.

Zugerberg Income Fund Credit Opportunities Fund
Yield in 2026 (since the beginning of the year) - 0.7% - 0.7%
Yield since the start (annualized) -7.2% (-0.95%) +37.8% (+2.4%)
Proportion of months with positive yield 57% 68%
Credit risk premium in basis points (vs. previous month) 102 BP (+9 BP) 421 BP (+63 BP)
Average rating (current) A- BB+

Real estate, infrastructure

Financing conditions remain favorable

In its March monetary policy assessment, the SNB left its key interest rate at 0.0%. We do not expect the key interest rate to change in the coming quarters either. This means that real estate financing is likely to remain within a historically favorable range and that construction-related momentum in the Swiss economy will continue, albeit increasingly in peripheral municipalities.

Read more Close
Aeschbach Quarter in Aarau (Photo: Markus Bertschi, Zurich / Copyright: Mobimo Holding AG)

In the coming quarters, interest rates for money market mortgages are likely to remain largely stable. However, slightly higher inflation expectations and banking regulatory requirements are expected to continue pushing interest rates for multi-year fixed-rate mortgages to a slightly higher level. As we explained in the “Bonds” section, interest rates rose in Switzerland, though much more moderately than abroad. Therefore, from a historical perspective, current and likely future financing conditions can still be described as favorable.

Risk-averse individuals tend to rely on long-term fixed-rate mortgages when financing their home ownership. While this is certainly not a bad approach in optimal mortgage financing, it remains advisable to stagger the fixed-rate periods to avoid exposure to the risk of an interest rate shock. For example, anyone who had to renew their entire mortgage debt at once in early March 2023 suddenly found themselves in an uncomfortable situation.

Ten-year Swiss government bonds yielded 0.3% at the end of March. This is the average since the beginning of the year – with relatively small fluctuations (0.2% to 0.4%). In the first quarter of 2026, various Swiss real estate companies were also able to refinance favorably on the Swiss franc capital market. They issue a variety of bonds to spread out the fixed-rate periods and reduce their exposure to fluctuation risks.

In January, Mobimo issued an approximately eight-year “green” bond with a coupon of 1.35%. PSP Swiss Property issued a bond of similar duration at 1.4% in late February. Swiss Prime Site opted for a shorter term (6 years), with a significantly lower coupon of 0.95%. It also issued a zero-coupon convertible bond.

All of these are large Swiss real estate companies with a broadly diversified portfolio and a structurally low debt ratio. As a private real estate investor with a single property, it is clear that the risk premium is likely to be higher.

In the longer term, demand for housing is expected to continue rising significantly in economically strong regions through 2040. While official spatial planning policy aims for densification, the restrictions of current spatial planning practices create a paradoxical tension: While spatial planning seeks to curb urban sprawl, a lack of space, rising land prices, and lengthy approval processes in dynamic urban centers are causing growth to shift to more distant municipalities. This typically results in longer commuting distances and increased traffic volume – precisely the issues that inner-city densification was intended to prevent.

Asset sub-class 3–6 months 12–24 months Analysis
Residential properties CH The long-term trend in building land prices in the housing market will continue to drive up home prices in the coming years.
Office and retail properties CH The politicization of housing supply is making it increasingly difficult to implement large-scale densification projects with more living space in urban centers.
Real Estate Fund CH Rental apartments remain scarce. Supply and market rents continue to rise, particularly in central locations and well-connected metropolitan areas.
Infrastructure Equity / Fund Energy infrastructure is the strongest growth area, both nationally and globally. High returns are expected over the next three to five years.

Equity

Market pressures from the Middle East

In March, stock markets fell sharply. The SMI (-8.8%) was unable to escape the global trend (world stock index -7.4%). As was the case with the tariff shock on “Liberation Day” on April 2, 2025, the ball is once again in U.S. President Donald Trump’s court. Just as a year ago, he holds the political lever in his hand and can move it in either direction. The markets understood this well a year ago and recovered quickly when his rhetoric began to shift. In the current war against the mullah regime in Iran, we see parallels, knowing full well that communication remains opaque.

Read more Close
The Swiss Market Index including Dividends from January 1, 2025, to March 31, 2026 (Source: Bloomberg L.P. | Chart: Zugerberg Finanz)

In March, sentiment among both retail and institutional investors shifted significantly from optimism to pessimism. We view this, along with the rise in volatility, as an opportune moment to increase equity exposure.

A year ago, the SMI experienced a 16% decline in a very short period of time. The recovery began quickly and recouped the paper losses. A similar pattern can be observed in March 2026. After hitting a low of around 12,060 points at noon on March 23, the recovery began. By the end of the month, the SMI had already rebounded to 12,777 points: +5.9% from the low and only 3.7% lower than at the start of the year.

A renewed short-term decline in the event of an escalation certainly cannot be ruled out. However, in our base scenario, we anticipate a medium-term recovery accompanied by “normalized” energy prices. We would like to remind you that the best moments in the stock markets are very close to the worst. Anyone who exits the market and then changes their mind – sometimes just half an hour later – risks losing an entire year’s return by doing so.

We made changes to our equity allocation in March. In risk class 1 (max. 20% equity allocation), we moved closer to this limit, particularly with Swiss equities, because valuations and timing appear favorable to us from a longer-term perspective.

In risk class 5 (e.g., Revo5), we still held 10% of the total allocation in high-yield bonds. We have completely sold this position and invested the corresponding capital in a broad diversification of international stocks. This has significantly improved the medium- and long-term recovery potential. We have also reduced the size of various company-specific positions in order to benefit even more strongly from the overall market recovery through certain ETF components.

With Swiss equities, we are focusing even more strongly than before on a stock’s dividend strength. The 2026 dividend season is indeed proving to be bountiful. Despite the crisis in the Middle East, more than 80% of the companies in our portfolios have proposed a dividend increase. For heavyweights such as Novartis and Roche, the dividend payout has already taken place.

Asset sub-class 3–6 months 12–24 months Analysis
Equity Switzerland With a price-to-earnings ratio of 17.5, SMI investors enjoy a dividend yield of 5.7%. This can be increased through disciplined stock selection.
Equity Eurozone, Europe The energy, energy infrastructure, and telecommunications sectors performed best in the first quarter, while media, luxury goods, and autos performed worst.
Equity USA The Nasdaq tech index reached an unusual level by the end of March (-7.6% year-to-date) – with heavyweights such as Microsoft (-24%) and Amazon (-10%).
Equity Emerging markets The MSCI Emerging Markets Index fell back to its year-to-date level in March (-12.8%) – an ideal time to slightly increase the position.

Alternative investments

Energy prices are causing increased volatility

Financial market volatility has moved largely in tandem with energy prices over the past five quarters. In the past, periods of high volatility have consistently proven to be favorable entry points or times when it was worthwhile to increase equity exposure. There are numerous indications that this may be the case again. This is because the main sellers in the stock markets were hedge funds, which sold stocks (short) for six consecutive weeks – the largest wave of selling since April 2025.

Read more Close
Energy Price Trends from January 1, 2025, to March 31, 2026 (Source: LSEG Datastream | Chart: Zugerberg Finanz)

Just as quickly as the sales are made, positions can be covered again, which can then be observed in retrospect as a “V-shaped recovery” in the index trend. Developments in the technology sector involving AI agents triggered the first wave of uncertainty, while those in the energy markets triggered a second. Algorithmic selling waves reached massive proportions over the last 30 trading days (-$85 billion). This was the largest wave since the sell-off six years ago during the pandemic (-$105 billion). Short positions reached a 15-year high in some indices (e.g., Russell 3000), or at least the level seen in April 2025 (“Liberation Day”).

AI fears cannot be dispelled in the short term. But the scale of the impact on the global oil supply may be exaggerated. Certainly, transit through the Strait of Hormuz plays a special role. 19.3% (2025) passed through the strait, while 80.7% took a different route. Typically, there were around 80 to 100 daily passages by energy tankers. Currently, due to the escalation of the Iran conflict, there are only sporadic ones. This de facto blockade has led to higher energy prices worldwide since mid-February.

In March, the price of Brent crude oil rose from $73 to $118 (+62%). However, Saudi Arabia is now already using a different pipeline to ship its oil. 80% of the Iranian oil shipped went via Malaysia to China, whose energy system relies heavily on coal but much less on oil and gas than, for example, Germany. The Middle East accounts for only 4% of Europe’s gas supply directly, but the ripple effects are global in nature.

Over the coming weeks, we expect financial markets to gradually cushion the downward pressure associated with the crisis in the Middle East. The prospect of talks between the United States and Iran is helping to limit downside potential and unlock upside potential. We are likely to remain in a period of heightened tensions for some time, as external diplomatic efforts cannot really be taken seriously.

The markets’ attention therefore remains focused on the development and duration of the tensions, while the broader global macroeconomic context takes a back seat. A potential rise in energy prices, provided it is only “temporary,” is unlikely to significantly impair growth prospects, as we explained at the beginning of this monthly report.

Asset sub-class 3–6 months 12–24 months Analysis
Commodities Iran is the third-largest producer within OPEC. Before the war began, approx. 1.5 million barrels of oil flowed daily from Iran to China, accounting for about 50% of total production.
Gold, precious metals Gold has failed as a safe-haven asset. The gold price has fallen sharply from its peak (-18%) and ended the first quarter of 2026 at CHF 3,706/oz.
Insurance Linked Securities Risk premiums have generally risen slightly. Currency hedging costs for Swiss franc investors remain high (USD/CHF 3.9%).
Private equity The entire industry is under massive pressure from hedge funds, but we are confident that the current discount valuations will disappear.

Summary

Asset class 3–6 months 12–24 months Analysis
Macroeconomics Global growth remains robust (+3.0% in 2026), but depends heavily on the opening of the Strait of Hormuz. Ceasefire talks will start soon.
Liquidity, currencies Inflation expectations have risen due to higher energy prices, though less so in Switzerland than abroad. As a result, the Swiss franc has appreciated in real terms.
Bonds Corporate bonds are becoming more attractive again. Yields to maturity significantly exceed our inflation expectations in Swiss francs.
Real estate, infrastructure The appetite for risk when investing in stocks and bonds of real estate and infrastructure companies has increased significantly over the past quarter.
Equities Due to declining risk appetite, financial market volatility rose sharply in the short term—as measured by the VIX (26 as of the end of March) and the MOVE (108).
Alternative investments Prices for commodities such as oil, gas, and fertilizers surged in March because the Strait of Hormuz remained effectively closed to trade.

Market data

Asset class Price (in local currency) Monthly / YTD / Annual performance (in CHF)
Equity 31.03.2026 03/2026 2026 YTD 2025 2024 2023
SMI CHF 12'776.8 –8.8% –3.7% +14.4% +4.2% +3.8%
SPI CHF 17'835.7 –7.4% –2.1% +17.8% +6.2% +6.1%
DAX EUR 22'680.0 –8.7% –7.9% +21.6% +20.4% +13.1%
CAC 40 EUR 7'816.9 –7.3% –4.8% +9.4% –1.0% +9.6%
FTSE MIB EUR 44'309.7 –4.5% –2.0% +30.0% +14.1% +20.4%
FTSE 100 GBP 10'176.5 –4.6% +1.6% +14.1% +12.1% –0.3%
EuroStoxx50 EUR 5'569.7 –7.7% –4.5% +17.3% +9.6% +12.1%
Dow Jones USD 46'341.5 –1.4% –2.7% –1.3% +22.1% +3.5%
S&P 500 USD 6'528.5 –1.1% –3.7% +1.7% +33.4% +13.1%
Nasdaq Composite USD 21'590.6 –0.8% –6.2% +5.2% +39.2% +30.6%
Nikkei 225 JPY 51'063.7 –11.2% +1.0% +10.9% +15.2% +8.6%
Sensex INR 71'947.6 –11.1% –18.9% –9.3% +13.8% +7.4%
MSCI World USD 4'258.3 –2.6% –3.0% +4.4% +26.6% +10.8%
MSCI EM USD 1'397.2 –9.6% +0.4% +14.1% +13.6% –2.6%
Bonds (mixed) 31.03.2026 03/2026 2026 YTD 2025 2024 2023
Glob Dev Sov (Hedged CHF) CHF 149.7 –2.3% –1.3% –1.0% –1.4% +2.2%
Glob IG Corp (Hedged CHF) CHF 184.6 –2.4% –1.6% +2.5% –0.8% +4.2%
Glob HY Corp (Hedged CHF) CHF 372.3 –2.4% –1.9% +5.4% +6.1% +8.7%
USD EM Corp (Hedged CHF) CHF 281.1 –3.4% –2.3% +5.9% +2.4% +4.5%
Government bonds 31.03.2026 03/2026 2026 YTD 2025 2024 2023
SBI Dom Gov CHF 185.3 –1.4% –0.6% –0.2% +4.0% +12.5%
US Treasury (Hedged CHF) CHF 137.2 –2.2% –1.1% +1.7% –3.8% –0.5%
Eurozone Sov (Hedged CHF) CHF 174.7 –2.9% –1.2% –1.8% –0.8% +4.8%
Corporate bonds 31.03.2026 03/2026 2026 YTD 2025 2024 2023
CHF IG Corp (AAA-BBB) CHF 192.7 –0.9% +0.2% +0.7% +5.1% +5.7%
USD IG Corp (Hedged CHF) CHF 186.9 –2.4% –1.6% +3.1% –2.4% +3.5%
USD HY Corp (Hedged CHF) CHF 622.7 –1.6% –1.5% +4.0% +3.7% +8.5%
EUR IG Corp (Hedged CHF) CHF 166.3 –2.5% –1.6% +0.7% +2.0% +5.9%
EUR HY Corp (Hedged CHF) CHF 304.6 –2.7% –2.1% +2.8% +5.4% +9.8%
Alternative investments 31.03.2026 03/2026 2026 YTD 2025 2024 2023
Gold Spot CHF/kg CHF 119'987.5 –10.0% +9.0% +43.8% +36.0% +0.8%
Commodity Index USD 135.2 +15.8% +24.5% –2.9% +8.3% –20.4%
SXI SwissRealEstateFunds TR CHF 2'865.6 –5.3% –3.9% +9.9% +16.0% +5.4%
Currencies 31.03.2026 03/2026 2026 YTD 2025 2024 2023
US dollar / Swiss franc CHF 0.7995 +3.9% +0.9% –12.8% +7.8% –9.0%
Euro / Swiss franc CHF 0.9237 +1.7% –0.8% –1.0% +1.2% –6.1%
100 Japanese yen / Swiss franc CHF 0.5036 +2.1% –0.5% –12.1% –3.4% –15.4%
British pound / Swiss franc CHF 1.0573 +1.9% –1.0% –6.1% +6.0% –4.2%
Back to News