Monthly Report 05/2026

Publications

Gap Between Headlines and Reality Persists

The conflict in the Middle East is wearing on everyone’s nerves. Sometimes it’s about negotiations, sometimes threats, sometimes “ultimatums”. According to recent assessments, expectations lean more toward a stopgap solution or an extension than a clear, lasting agreement. Nevertheless, a deal could still be reached, as Iran needs revenue. These revenues will dry up if the U.S. blocks oil and gas exports. But even U.S. President Donald Trump seems to have had enough of the war, enough of the uncertainty, and enough of the higher energy prices. The midterm elections are just around the corner—and nothing is as damaging to an election in the U.S. as rising inflation expectations, higher gas prices, higher heating costs, and higher interest rates on loans.
The gap between headlines and reality remains wide. The global economy is growing despite all the geopolitical tensions. The immense technological progress driven by AI is triggering widespread investment, which is offsetting setbacks in other areas. In the US, overall economic growth in the first quarter of 2026 (+2.0%) was slightly higher than in Europe. However, Asia remains the region with the strongest growth—despite all the risks in the Middle East. On the stock markets in April, technology stocks in particular stood out with their cloud-based AI investments, as did all other stocks involved in this boom.

Optimism returned in April

Capital markets struggled with high volatility in March due to geopolitical developments. In April, risk appetite returned and volatility subsided. It was not “quality” that took center stage among stocks, but “tech.” This is symptomatic of the following situation: The Swiss Market Index rose slightly in April (+2.8%), while the Nasdaq tech index (+12.9%) reacted much more strongly. In its wake, the S&P 500 also rose (+8.8% in dollars), while the Euro Stoxx 50 gained +6.6% (in euros). Because the euro appreciated by about 2% against the dollar in April, these returns are comparable on a currency-adjusted basis.

About nine weeks after the start of hostilities in the Middle East, the capital markets appear surprisingly calm. Corporate bonds and stocks are more or less back at the same levels as at the start of the year. Although the oil price traded at around $120 per barrel at the height of the war, deliveries at $80 per barrel in the spring of 2027 are already being agreed upon in the futures market. The markets are pricing in a gradual reopening of the Strait of Hormuz, which has also led to a partial recovery in the stock markets. Should the reopening occur, we expect significantly higher stock prices.

In the lowest risk class (Revo1: +0.6%), the withholding tax credit of 0.4% must be added. In fact, the total return in April was higher (at +1.0%), though lower than in the higher risk classes (Revo3: +2.5%, Revo5: +4.1%). The dividend-focused strategy posted a smaller gain (+2.3%) due to the absence of technology stocks.

Our DecarbRevo solutions delivered the most encouraging returns. This is attributable to the strong demand for decarbonized energy and the corresponding energy infrastructure. In particular, high prices for fossil fuels and uncertainties surrounding their transportability are opening up new prospects for business models capable of generating and storing energy locally.

Strategies mainly based on individual titles, supplemented by ETFs and investment funds Strategy performance*
April 2026 2026 YTD
Zugerberg Finanz R1 +0.5% –1.8%
Zugerberg Finanz R2 +1.5% –1.9%
Zugerberg Finanz R3 +2.3% –1.4%
Zugerberg Finanz R4 +2.9% –1.1%
Zugerberg Finanz R5 +3.8% –0.8%
Zugerberg Finanz RDividends +2.3% +1.1%
Zugerberg Finanz Revo1 +0.6% –1.5%
Zugerberg Finanz Revo2 +1.7% –1.8%
Zugerberg Finanz Revo3 +2.5% –1.4%
Zugerberg Finanz Revo4 +3.0% –1.1%
Zugerberg Finanz Revo5 +4.1% –0.9%
Zugerberg Finanz RevoDividends +2.3% +0.6%
Zugerberg Finanz DecarbRevo3 +6.6% +11.4%
Zugerberg Finanz DecarbRevo4 +7.4% +14.1%
Zugerberg Finanz DecarbRevo5 +8.1% +15.7%
Zugerberg Finanz Vested benefits Strategy performance*
April 2026 2026 YTD
Zugerberg Finanz Vested benefits R0.5 –0.3% –1.9%
Zugerberg Finanz Vested benefits R1 +0.5% –1.9%
Zugerberg Finanz Vested benefits R2 +1.1% –1.9%
Zugerberg Finanz Vested benefits R3 +2.0% –1.5%
Zugerberg Finanz Vested benefits R4 +2.9% –1.3%
Zugerberg Finanz Vested benefits R5 +3.8% –0.8%
Zugerberg Finanz Vested benefits RDividends +2.3% +1.1%
Zugerberg Finanz 3a pension solution Strategy performance*
April 2026 2026 YTD
Zugerberg Finanz 3a Revo1 +0.6% –1.5%
Zugerberg Finanz 3a Revo2 +1.7% –1.8%
Zugerberg Finanz 3a Revo3 +2.5% –1.4%
Zugerberg Finanz 3a Revo4 +3.0% –1.1%
Zugerberg Finanz 3a Revo5 +4.1% –0.9%
Zugerberg Finanz 3a RevoDividends +2.3% +0.6%
Zugerberg Finanz 3a DecarbRevo3 +6.6% +11.4%
Zugerberg Finanz 3a DecarbRevo4 +7.4% +14.1%
Zugerberg Finanz 3a DecarbRevo5 +8.1% +15.7%
* The stated performance is net, after deduction of all running costs, excluding contract conclusion costs

Macroeconomics

Uncertainty and Concern

Recent events in the Middle East have triggered significant uncertainty and concern among investors worldwide. In these difficult times, however, it remains essential to pause and assess the potential impact on assets as well as general market outlooks. Our base case continues to assume robust global economic growth, which will also be associated with positive prospects for real assets, partly due to the investment cycle surrounding AI.

Read more Close
Growth forecasts by region – April 2026 (Image source: International Monetary Fund, www.imf.org)

Markets continue to view the turmoil in the Middle East as an inflation shock; oil prices are rising, inflation is rising – in the Eurozone, for example, from 1.9% in February to 3.0% in April. Certain prices of raw materials integrated into global supply chains, such as helium, sulfites, and fertilizers, have also risen, as have those of aluminum and nickel. Conversely, there are also deflationary effects. Expensive services such as translations and tedious standard programming tasks can largely be replaced by cost-effective AI. China’s export goods also have a deflationary effect, driving prices down in Western markets.

The decisive factor, however, is duration: When does a supply shock begin to affect not only prices but also growth? Price shocks are short-lived. They alter the level—but not the trend. Stock valuations, by contrast, are structural in nature. A decline in price-to-earnings ratios typically stems from weaker sector or earnings outlooks.

Currently, therefore, we are dealing with a price shock and not a valuation shock. This points to a temporary disruption rather than a deterioration. And now comes the crucial point of this distinction. A price shock thus offers an opportunity to strengthen one’s asset pyramid by investing liquidity from the household into structurally sound growth strategies at relatively low prices.

We cannot make a precise forecast regarding the duration of the shock, but the oil futures markets provide deep insights. The trend in energy prices appears to be only temporary in nature. It is unlikely to last long enough to spill over into general economic activity and expectations. The steep backwardation in the oil futures curve points to lower prices over the coming months, but also signals future supply bottlenecks on a scale that will keep growth on track and prevent a growth or valuation shock (e.g., lower price-to-earnings ratios).

Will there be a decline in demand? If higher prices were to start dampening consumption and the economy, this would indicate a shift from price pressure to a deterioration in growth. So far, however, there are no significant signs of this, but we will be closely monitoring the labor market and consumption. In the U.S., for example, there has recently been a slight decline in the savings rate, meaning that higher prices have been met with lower savings. This may work temporarily, but hardly in the long run.

Region 3–6 months 12–24 months Analysis
Switzerland In Switzerland, the adoption of AI is still in its early stages. Consequently, there has not yet been a rise in labor productivity from 1.0% per annum to the previous 1.3%.
Eurozone, Europe The energy price shock eased in April, and core inflation remained virtually unchanged from March at 2.3%. This is cautiously positive.
USA The fundamentally positive outlook for the current expansionary fiscal policy has changed little recently. The U.S. has become the world’s leading oil exporter.
Rest of the world Asia is hardest hit by rising energy prices. This makes it difficult for companies to generate returns above their cost of capital.

Liquidity, currency

Stability of the cost of living

In times of rising energy prices, many households face the challenge of stabilizing their cost of living without making significant cutbacks. In the U.S. economy, approximately 12.5% of household spending is currently spent at gas stations. Recently, this share was still at 7%. An increase in spending in one area tends to lead to savings in other areas—unless the savings rate is temporarily reduced or the number of hours worked is increased.

Read more Close
The Global Economy Faces Many Challenges (Graphic: Zugerberg Finanz)

Household liquidity depends on one key factor: the number of hours worked, which is ultimately the decisive determinant of household income. If the number of aggregate (gainful) working hours increases, this leads to additional consumption and, ultimately, to growing gross domestic product (GDP).

GDP growth can also be boosted by an increase in labor productivity, which ultimately leads to higher hourly wages over the long term. According to OECD analyses, it is primarily large companies that exhibit above-average productivity growth. This is likely due in many cases to product and process innovations. In addition, large companies benefit more from economies of scale and network effects and can, for example, better spread costs incurred to meet regulatory requirements across larger sales volumes.

As we also observe in the capital markets, larger companies typically exhibit greater profit resilience: due to their market position, they can either better absorb or pass on higher costs. This was already evident during the COVID-19 pandemic.

The global economy faces numerous challenges. Yet fears of stagflation seem exaggerated to us. Rather, we are observing robust revenue and profit growth. This is particularly pronounced in the technology sector, where investment plans for cloud and AI have recently been ramped up. Currently, the sustainability of profits across the entire economic cycle is being reassessed. Energy-related input costs account for only a small portion of the rapidly expanding revenues for cloud services.

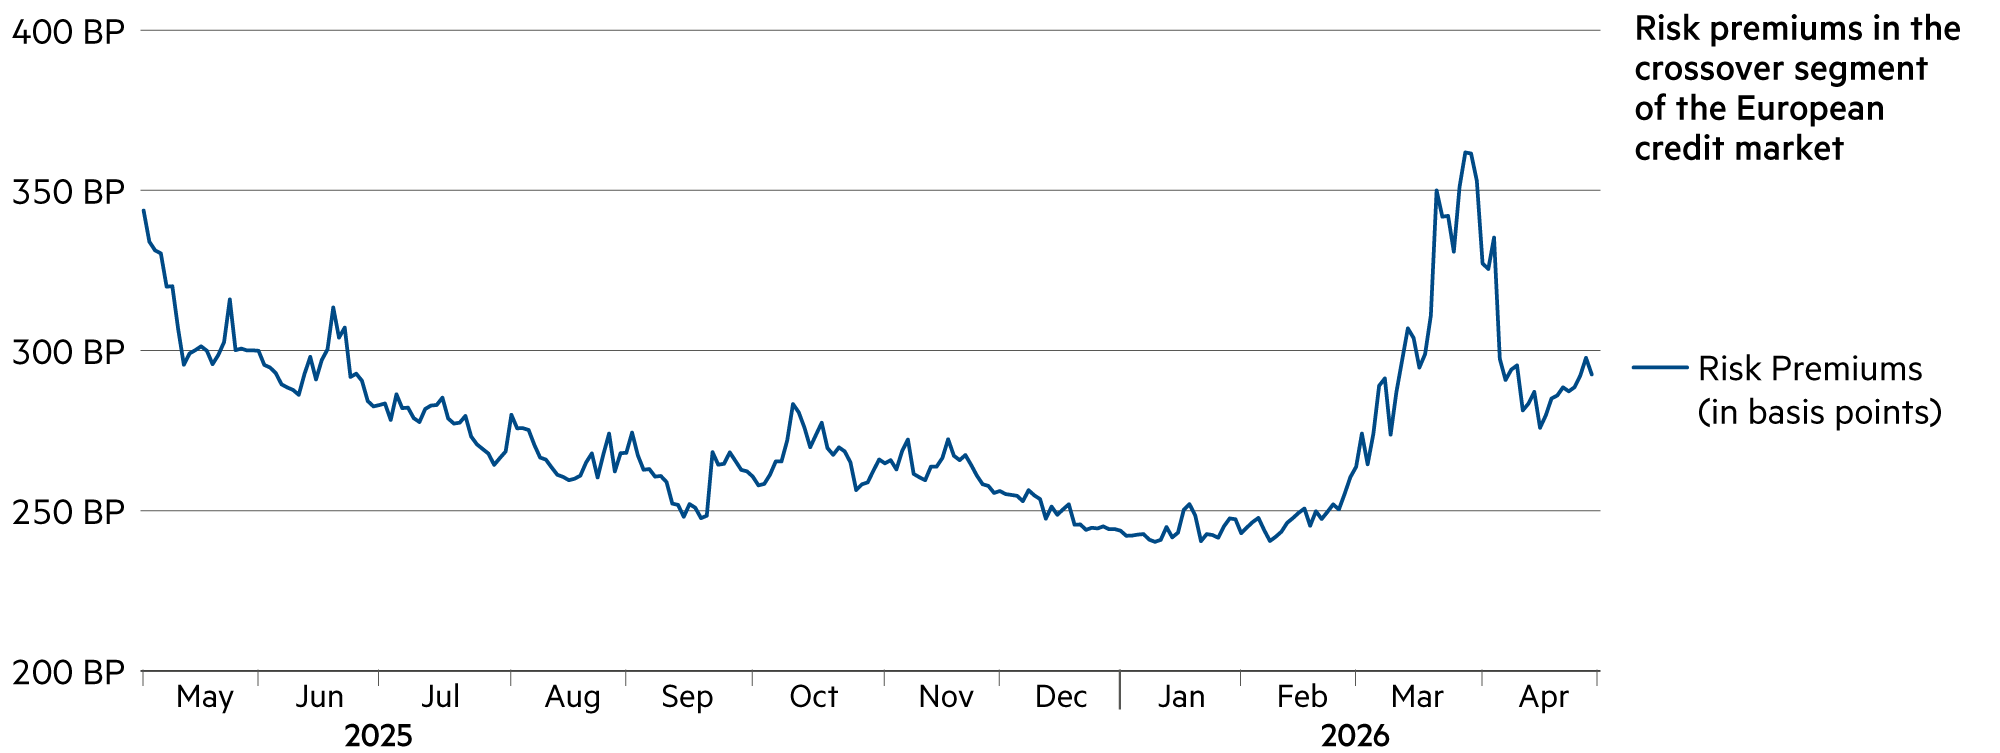
Credit markets react sensitively to fundamental changes in the capital markets. Yet since the start of the year, they have remained resilient, suggesting that the recalibration of power dynamics in the Middle East is not viewed as fundamentally “earth-shattering.” Credit spreads, which widened amid heightened risks of escalation, have already narrowed again, indicating reduced stress, even though central banks have not responded by easing monetary policy. The strength of the U.S. dollar is in line with expectations but is likely to ease again once tensions subside.

Asset class 3–6 months 12–24 months Analysis
Bank account SARON swap rates remain slightly negative for maturities up to 6 months. 10-year swap rates, on the other hand, stand at +0.6%.
Euro / Swiss franc At 0.92, the euro is showing its strength even at the start of May, as the ECB has so far detected “no second-round effects” in inflation trends.
US dollar / Swiss franc At 0.79, the USD/CHF exchange rate is about 1% lower at the start of May than at the beginning of the year, though fluctuations are more pronounced than with the euro.
Euro / US dollar At 1.17, the EUR/USD exchange rate is back at exactly the same level at the start of May as it was at the beginning of the year.

Bonds

Credit surge for data centers

Fitch Ratings’ latest industry overview highlights AI-related credit risks in the technology, media, and telecommunications sectors, coupled with risks from disruptive changes and overinvestment, particularly in data centers. The adoption of AI will be gradual and focused on efficiency gains, with traditional credit risk factors remaining at the forefront.

Read more Close
A $300 billion wave of credit for data centers and AI infrastructure (AI-generated image; Adobe Firefly)

Following a “$300 billion credit frenzy” in the AI sector that swept every corner of the credit market, investors are gradually showing signs of fatigue. Demand for such deals remains strong. However, bankers have recently had to work harder to sell them and offer investors—who are spoiled for choice—more incentives and higher returns.

Just a few days ago, they had the choice of participating in Meta Platforms’ massive investment-grade offering or taking on more risk and looking at CoreWeave’s latest leveraged loan deal.

There were clear signs of waning enthusiasm. Moreover, investors have recently been demanding more protection and more favorable terms. Borrowers are also agreeing to repay part or all of the principal before maturity—a clause known as “amortization,” which reduces risk over the long term. However, there are also other voices. Many rejected the billion-dollar bond issue for an Oracle data center in Michigan, in part because the bonds are callable. This increases the risk for creditors that a borrower could refinance at a lower interest rate once construction is complete.

The structures and terms of such bonds are likely to continue improving in the coming quarters. This is because there are many signs of underlying uncertainty in a market that has held up well so far but is still relatively young and untested.

Given estimates that the expansion of AI will cost around $3 trillion by 2030, the volume of borrowing is likely to rise even further from here. Because many investors hold these bonds via passive ETFs, they will automatically fuel the debt boom. We see a mounting wall of concerns here and are keeping our exposure to data center bonds relatively low for the time being.

The need for careful scrutiny is even more critical in the riskier segments of the credit market. What reassures investors is a connection to a hyperscaler—a company with a massive cloud computing operation like Google, Amazon, and Microsoft—either as a tenant or as a counterparty. A partnership with a tech giant can also help data center developers obtain investment-grade ratings.

The tech giants show no signs of slowing down. Five hyperscalers reported their financial results at the end of April and reaffirmed their intention to invest heavily in data centers and the chips needed to power them. Nevertheless, there are several factors investors should consider when thinking about buying data center bonds. A hyperscaler’s involvement does not eliminate all risks.

Asset sub-class 3–6 months 12–24 months Analysis
Government bonds The expected outcome of investments in government bonds is typically lower volatility and smaller drawdowns. In practice, however, this is not the case.
Corporate bonds Our portfolios are constructed from many smaller positions, which reduces dependence on a single outcome (= diversification).
High-yield, hybrid bonds As volatility rises, dispersion increases. Pricing becomes more inconsistent, leading to distortions between similar bonds and regions.

Zugerberg Finanz bond solutions

Stabilization in April

In April, bond markets appeared largely unfazed by rising inflation figures and strained global supply chains. The monthly performance of the Swiss Bond Index (AAA-BBB Total Return) was marginally negative (-0.1%), exactly in line with that of the global bond index. In contrast, our defensive bond solution, the Zugerberg Income Fund, posted a slight gain (+0.3%). The Credit Opportunities Fund solidified its performance in April (+0.9%) and also performed well relative to its peers.

Read more Close
Risk premiums in the crossover segment of the European credit market from May 2025 to April 2026 (Source: iTraxx Europe Crossover Index | Chart: Zugerberg Finanz)

Activity in the bond markets was positive in April: numerous transactions were completed and new issuances announced. Investor interest remained strong, likely also because yields were pushed to a level that can be considered attractive in the longer term. Activity in the secondary market also improved. After a subdued start in April, sentiment turned more positive, and numerous bonds were once again trading with tighter spreads. Our bond fund, which focuses on credit opportunities, benefited from this in particular.

Most recently, market sentiment has been rather subdued, as uncertainty regarding the situation in the Strait of Hormuz persisted despite earlier signals from Iran. In the medium term, oil and gas futures point to a future accompanied by significantly lower energy prices. The Brent price reacts strongly to current headlines on the spot market for a short time. Prices can even exceed $120 per barrel at times. Most recently, it was $109, but the outlook remained volatile. Still, on the futures market, Brent was last trading at $80 for delivery in spring 2027.

In other words, the pricing of future energy deliveries anticipates a de-escalation of tensions. A formal peace agreement may not be within reach, but medium-term developments certainly remain focused on the reopening of the Strait of Hormuz. However, it is not facts but expectations that are traded in the markets. When expectations point to declining risks of escalation, bonds (and stocks) head toward higher prices. When expected risks of escalation rise, prices fall. Our two bond solutions, which proved stable amid the turmoil of the spring, thus still hold significant potential for recovery.

Global markets reflected expectations of an improved environment in the credit markets. While government bonds suffered slight losses in many places, corporate bonds gained slightly in April, particularly those with moderate credit ratings.

This can be observed in the risk premiums of the 75 most liquid corporate bonds in the European crossover segment. The iTraxx Europe Crossover Index surged to 362 basis points by the end of March as tensions in the Middle East escalated. Over the course of April, the index narrowed rapidly by 50 basis points and ultimately closed at 285 basis points. Similar developments were observed in U.S. high-yield bonds: The corresponding CDX-HY Index narrowed in virtually parallel fashion over the course of April. In other words, the dynamics in the high-yield market were such that the COF was able to benefit from them more than the ZIF.

Zugerberg Income Fund Credit Opportunities Fund
Yield in 2026 (since the beginning of the year) -0.7% +0.2%
Yield since the start (annualized) -7.2% (-0.9%) +39.1% (+2.5%)
Proportion of months with positive yield 57% 68%
Credit risk premium in basis points (vs. previous month) 94 BP (-8 BP) 352 BP (-69 BP)
Average rating (current) A- BB+

Real estate, infrastructure

Tripling of home prices

Since 2000, home prices in Switzerland have tripled. Compared to the previous year, the strongest price movement was observed in the mid-range segment (+7.3% compared to the same quarter of the previous year), while growth in the higher-end segment was lower (+4.9%). Geographically, condominiums were particularly in demand in the Mittelland and Zurich regions as well as in the Alpine region.

Read more Close
Trends in residential property prices in Switzerland from 2000 to 2026 (Source: FPRE, April 2026 | Chart: Zugerberg Finanz)

The price trend over a longer period is impressive. Taking the beginning of 2000 as the base value (index = 100), prices for condominiums rose in virtually parallel fashion. Most recently, the index stood at 285 points in the lower market segment, 322 in the mid-range segment, and 310 in the upper-end segment. Over a 26-year period, these differences are practically negligible.

Another aspect concerns mortgage financing. If one had financed the purchase of a 500,000-franc apartment in the first quarter of 2000 with an 80% mortgage loan and had not amortized this loan, the 400,000-franc loan would now amount to only 26.7% of the market value. What is considered high leverage in the short term can be extremely attractive in the long term. This is because the initial equity of 100,000 francs has increased elevenfold to 1,100,000 francs over the same period.

Those who invested the freely available funds in a household with home ownership into high-yield securities markets via 3a pension solutions for the indirect amortization of mortgages were able to benefit even more.

The Swiss National Bank’s cycle of interest rate cuts has been considered complete since June 2025. We do not anticipate either negative or rising key interest rates. Rather, the status quo is likely to be maintained. With key interest rates remaining unchanged, money market mortgages with interest rates of around 1.0% remain attractive. Those who need more certainty regarding interest costs in the near and distant future should opt for a combined financing option with a ten-year fixed-rate mortgage.

Listed real estate investments have recovered from the price corrections resulting from the Middle East conflict. However, the outlook remains clouded, as premiums on the average book value of the largest real estate companies recently stood at around 40%. At the same time, the likelihood of negative interest rates has recently decreased. This also reduces the opportunities to lower discount rates and thereby drive up valuations.

For real estate funds, premiums recently stood at around 35% above the average book value. Their appeal has recently waned. The SXI Swiss Real Estate Funds Index has even been in negative territory recently (-0.5% year-to-date). This does not mean, however, that a few carefully selected funds do not still offer prospects. Yet numerous capital increases are weighing on price performance.

Asset sub-class 3–6 months 12–24 months Analysis
Residential properties CH The investment-unfriendly environment will cause supply in the urban housing market to rise less sharply than demand: This will lead to higher rents.
Office and retail properties CH With PSP Swiss Property (+11.5% since the start of the year), we are invested in the market leader and continue to see good medium-term growth prospects there.
Real Estate Fund CH Premiums amount to around 35%, thereby limiting the price potential of real estate funds. Since the start of the year, the total return has been -0.5%.
Infrastructure Equity / Fund Energy infrastructure remains the strongest growth area, both nationally and globally. High returns are expected over the next three to five years.

Equity

Positive 13-month performance despite volatility

Investors have had to be patient over the past 13 months, but it has been worth the wait. While bond markets, for example, showed little movement (Switzerland: +1.0%, global: -1.3%), equities posted significant gains. In Swiss francs, the MSCI Europe (+13.7%) nearly kept pace with the broad U.S. S&P 500 Index (+15.1%). The typically defensive Swiss stock market (SMI: +9.1%) performed somewhat more modestly.

Read more Close
The Swiss Market Index, the S&P 500, and the MSCI Europe (including dividends) from March 31, 2025, to April 30, 2026 (Source: Bloomberg L.P. | Chart: Zugerberg Finanz)

This observation is also the main reason why we are enriching our Swiss focus with international diversification. However, this also comes with higher volatility. In April 2026 alone, the S&P 500 Index rose sharply (+7.9% in Swiss francs), significantly more than the MSCI Europe (+4.6%) and the SMI (+4.2% including dividends).

The S&P 500 Index is heavily weighted toward technology stocks. During the first-quarter 2026 earnings season, these proved particularly resilient. 80% of all U.S. companies have exceeded expectations in the earnings season so far, and not just marginally: Earnings expectations have been significantly exceeded by around 23% to date.

In Europe, 62% of companies have exceeded expectations. However, the positive surprise factor for earnings expectations was only 2%. Double-digit earnings growth rates are also expected in the U.S. for the remainder of the year, while expectations in Europe are significantly lower. This is also related to the fact that the technology weighting in the S&P 500 Index is much higher than in comparable indices in Europe. For example, there is not a single major technology company in the SMI.

The latest reports are also factored into earnings estimates for the coming years. At the start of the year, Europe was projected to see earnings growth of around +11.7% (Stoxx Europe 600) and +12.4% (Euro Stoxx) in 2027. The picture has hardly changed following this earnings season. For the S&P 500, growth of +15.2% was still expected in January 2026; these estimates have since been revised significantly upward to +17.5%. In other words: Fundamentals are improving most rapidly for U.S. stocks. The current profit margin of 15.2% is expected to rise to a very high 21.0%, partly due to AI-related productivity gains, thereby increasing return on equity from 4.3% to 6.9%.

This is significant because it will lead to a substantial improvement in the price-to-earnings ratio (P/E ratio) in the future, particularly in the U.S. While the benchmark index is currently trading at a P/E ratio of 26, this valuation will decline to 22 by the end of 2026 and to a moderate 19 by the end of 2027 due to earnings growth.

The expected earnings and margin growth for the SMI is more modest. The profit margin is expected to improve only marginally overall in the coming quarters, causing the current P/E ratio of 19 to fall to 18 by the end of 2026 and to 17 by the end of 2027.

Asset sub-class 3–6 months 12–24 months Analysis
Equity Switzerland ABB (+24%), UBS (+15%), Holcim (+12%), and Sika (+11%) led the SMI. Alcon (-2%), Novartis (-4%), and Lonza (-5%) were at the bottom of the April rankings.
Equity Eurozone, Europe The technology (+14% in EUR) and banking (+10%) sectors led the way in April; energy (+1%) and healthcare (-1%) were the worst performers.
Equity USA Tech leaders shone in April, led by Alphabet (+34% in USD), Amazon (+27%), Nvidia (+14%), and Microsoft (+10%).
Equity Emerging markets The MSCI Emerging Markets Index made positive headlines again in April (+14.7% in USD). The main drivers were semiconductor companies in Asia.

Alternative investments

European Energy Supply Under Geopolitical Stress

Europe—and right in the middle of it, the small economy of Switzerland—remains structurally vulnerable to energy price shocks. The war in Iran was a stark reminder of this. Because we are not doing enough to promote renewable energy sources (hydro, wind, solar), energy independence remains a distant prospect. Although Europe sources only about 4% of its gas and relatively little oil from the Middle East, our continent remains heavily affected by global price fluctuations resulting from geopolitical tensions.

Read more Close
Trend in European gas prices from January 1, 2021, to April 30, 2026 (Source: Bloomberg L.P. | Chart: Zugerberg Finanz)

Fundamentally, it is a positive development that energy intensity in economic output has declined significantly in Europe over the past decades. The transportation sector, which is 73% dependent on oil, is less significant than in the U.S., where much greater distances must be logistically managed.

Not every sector is equally vulnerable to shocks. In European industry, a significant portion of final energy consumption is covered by gas. Supply chains also vary in robustness depending on the energy source. LNG imports from the U.S. now account for 45% of Europe’s imports and enhance resilience. In any case, when comparing gas prices in Europe in March 2026 with those in 2021/22, the most recent fluctuations were less pronounced.

Seasonality also plays a role in the European gas price. It has plummeted well below its oil equivalent, Brent, possibly in connection with subdued LNG demand in Asia and strong supply from the US. However, traders may also have underestimated the impact of the off-season. In Europe in particular, this period is known for low consumption and high demand flexibility.

In a world of energy scarcity, however, we maintain the view that oil remains the ultimate benchmark and plays a leading role in energy pricing, which is why the European gas price—at least in the short term—still has “oil-driven upside potential.” According to industry studies, the EU’s natural gas reserves stand at around 30%, which is about 6.5 percentage points below the previous year’s level.

Nuclear energy also plays a role, which is why inflation in France, for example, is significantly lower than in Germany, and Paris has the edge over Berlin in the competition for new industrial investments, stable energy supplies, and future-oriented jobs.

In the long term, structural transformation will be necessary to achieve robust energy autonomy by mid-century. A central role in this is played by the expansion and increased flexibility of the power grids, whose congestion costs could double by 2040 without countermeasures. Spain can produce a great deal of solar energy, but the transmission lines are lacking to harness this potential for continental Europe.

The potential for wind energy generation in the Atlantic off the coast of France is also untapped. Strategically, this has been neglected for decades to avoid competing with domestic electricity production from nuclear power plants. Overall, investments of around 2,200 billion euros are estimated for grids by 2050, as well as approximately 100 billion euros annually for renewable energy.

Asset sub-class 3–6 months 12–24 months Analysis
Commodities OPEC+ decided to increase oil production, which caused prices to drop slightly in the first few days of May.
Gold, precious metals Overall, Bitcoin (+15%) once again sent positive signals in April. Possibly as a risk investment and a diversification from the U.S. dollar.
Insurance Linked Securities There were no substantial changes in the insurance risk business in April. Risk premiums remain attractive.
Private equity The latest quarterly reports demonstrated favorable resilience in an extremely challenging environment. Private infrastructure investments delivered high returns.

Summary

Asset class 3–6 months 12–24 months Analysis
Macroeconomics Almost as unpredictable as Donald Trump’s military interventions are the new tariff threats from the White House, which are increasing risks to the global economy.
Liquidity, currencies Despite a short-term rise in inflation, medium-term inflation expectations have remained stable. Central banks therefore made no changes to their policies.
Bonds Corporate bonds had a good month. Risk premiums fell, which initially contributed to stability and ultimately led to slight price gains.
Real estate, infrastructure Real estate stocks got off to a good start in 2026. At current levels, we expect a sideways trend.
Equities Risk appetite increased, causing volatility metrics to drop significantly: the VIX to 17 by the end of April; the VSMI fell from over 24 at the end of March to 18 by the end of April.
Alternative investments High energy prices increase the risk of stagnation and recession in a worst-case scenario. Overall, however, we continue to view this risk as low.

Market data

Asset class Price (in local currency) Monthly / YTD / Annual performance (in CHF)
Equity 30.04.2026 04/2026 2026 YTD 2025 2024 2023
SMI CHF 13'136.3 +2.8% –1.0% +14.4% +4.2% +3.8%
SPI CHF 18'551.1 +4.0% +1.8% +17.8% +6.2% +6.1%
DAX EUR 24'292.4 +6.3% –2.1% +21.6% +20.4% +13.1%
CAC 40 EUR 8'114.8 +3.0% –1.9% +9.4% –1.0% +9.6%
FTSE MIB EUR 48'246.1 +8.1% +5.9% +30.0% +14.1% +20.4%
FTSE 100 GBP 10'378.8 +2.3% +4.0% +14.1% +12.1% –0.3%
EuroStoxx50 EUR 5'881.5 +4.8% +0.1% +17.3% +9.6% +12.1%
Dow Jones USD 49'652.1 +4.7% +1.9% –1.3% +22.1% +3.5%
S&P 500 USD 7'209.0 +7.9% +3.9% +1.7% +33.4% +13.1%
Nasdaq Composite USD 24'892.3 +12.6% +5.6% +5.2% +39.2% +30.6%
Nikkei 225 JPY 59'284.9 +15.1% +16.3% +10.9% +15.2% +8.6%
Sensex INR 76'913.5 +3.9% –15.7% –9.3% +13.8% +7.4%
MSCI World USD 4'660.7 +6.9% +3.7% +4.4% +26.6% +10.8%
MSCI EM USD 1'600.2 +11.9% +12.4% +14.1% +13.6% –2.6%
Bonds (mixed) 30.04.2026 04/2026 2026 YTD 2025 2024 2023
Glob Dev Sov (Hedged CHF) CHF 149.4 –0.2% –1.5% –1.0% –1.4% +2.2%
Glob IG Corp (Hedged CHF) CHF 185.0 +0.3% –1.3% +2.5% –0.8% +4.2%
Glob HY Corp (Hedged CHF) CHF 379.1 +1.8% –0.1% +5.4% +6.1% +8.7%
USD EM Corp (Hedged CHF) CHF 285.7 +1.6% –0.7% +5.9% +2.4% +4.5%
Government bonds 30.04.2026 04/2026 2026 YTD 2025 2024 2023
SBI Dom Gov CHF 184.3 –0.5% –1.1% –0.2% +4.0% +12.5%
US Treasury (Hedged CHF) CHF 136.6 –0.4% –1.5% +1.7% –3.8% –0.5%
Eurozone Sov (Hedged CHF) CHF 174.9 +0.1% –1.1% –1.8% –0.8% +4.8%
Corporate bonds 30.04.2026 04/2026 2026 YTD 2025 2024 2023
CHF IG Corp (AAA-BBB) CHF 192.5 –0.1% +0.1% +0.7% +5.1% +5.7%
USD IG Corp (Hedged CHF) CHF 187.0 +0.1% –1.5% +3.1% –2.4% +3.5%
USD HY Corp (Hedged CHF) CHF 630.8 +1.3% –0.2% +4.0% +3.7% +8.5%
EUR IG Corp (Hedged CHF) CHF 167.6 +0.7% –0.8% +0.7% +2.0% +5.9%
EUR HY Corp (Hedged CHF) CHF 309.5 +1.6% –0.6% +2.8% +5.4% +9.8%
Alternative investments 30.04.2026 04/2026 2026 YTD 2025 2024 2023
Gold Spot CHF/kg CHF 116'009.7 –3.3% +5.4% +43.8% +36.0% +0.8%
Commodity Index USD 140.5 +1.5% +26.3% –2.9% +8.3% –20.4%
SXI SwissRealEstateFunds TR CHF 2'968.2 +3.6% –0.5% +9.9% +16.0% +5.4%
Currencies 30.04.2026 04/2026 2026 YTD 2025 2024 2023
US dollar / Swiss franc CHF 0.7814 –2.3% –1.4% –12.8% +7.8% –9.0%
Euro / Swiss franc CHF 0.9165 –0.8% –1.5% –1.0% +1.2% –6.1%
100 Japanese yen / Swiss franc CHF 0.4988 –1.0% –1.4% –12.1% –3.4% –15.4%
British pound / Swiss franc CHF 1.0629 +0.5% –0.5% –6.1% +6.0% –4.2%
Back to News